Show code
### this is just the code that creates the "copy to clipboard" function in the code blocks
htmltools::tagList(
  xaringanExtra::use_clipboard(
    button_text = "<i class=\"fa fa-clone fa-2x\" style=\"color: #301e64\"></i>",
    success_text = "<i class=\"fa fa-check fa-2x\" style=\"color: #90BE6D\"></i>",
    error_text = "<i class=\"fa fa-times fa-2x\" style=\"color: #F94144\"></i>"
  ),
  rmarkdown::html_dependency_font_awesome()
)
How to “nudge” plots
I can never remember how to do this and keep looking it up. Emily asked me about it so I thought I should crack it and make a file about it to remind myself.
I’m going to use a little function to get bootstrap confidence intervals around observed means so here’s the code for that.
Show code
### function using boot() and boot.ci() from the the boot package to get bootstrap CIs around observed means
getCIbootMean <- function(data, ciInt = .95, bootReps = 1000){
  getMeanForBoot <- function(dat, ind) {mean(dat[ind])} # ind indexes the particular bootstrap sample of vector dat
  tmpRes <- boot::boot(data, getMeanForBoot, R = bootReps)  # gets the boostrap results
  tmpCI <- boot::boot.ci(tmpRes, type =  "perc")$percent[1,4:5] # gets the percentile method CI
  return(list(LCL = tmpCI[1],
              obsMean = tmpRes$t0,
              UCL = tmpCI[2]))
}
# getCIbootMean(1:30) # testing!
Now let’s get some demonstation data.
Show code
n <- 500 # sample size
set.seed(1245) # get same result every run
tibble(genderNum = sample(0:1, n, replace = TRUE), # generate gender
       ageNum = sample(13:17, n, replace = TRUE), # generate age
       gender = if_else(genderNum == 1, "F", "M"),
       score = rnorm(n) + # get randomness unsystematically related to gender or age
         genderNum*.1*rnorm(n) + # add a simple gender effect
         ageNum*.1*rnorm(n) + # add a simple age effect
         (genderNum*(ageNum - 15)*.5*rnorm(n))^2 + # and an interaction
         20, # make sure values are positive
       age = as.factor(ageNum)) %>%
  group_by(age, gender) %>%
  summarise(mean = list(getCIbootMean(score))) %>%
  unnest_wider(mean) -> tibDat
Here’s a crude way to separate things by nudging them on the x axis.
Show code
ggplot(data = tibDat,
       aes(x = interaction(age, gender), y = obsMean, colour = gender)) +
       geom_point() +
       geom_linerange(aes(ymin = LCL, ymax = UCL))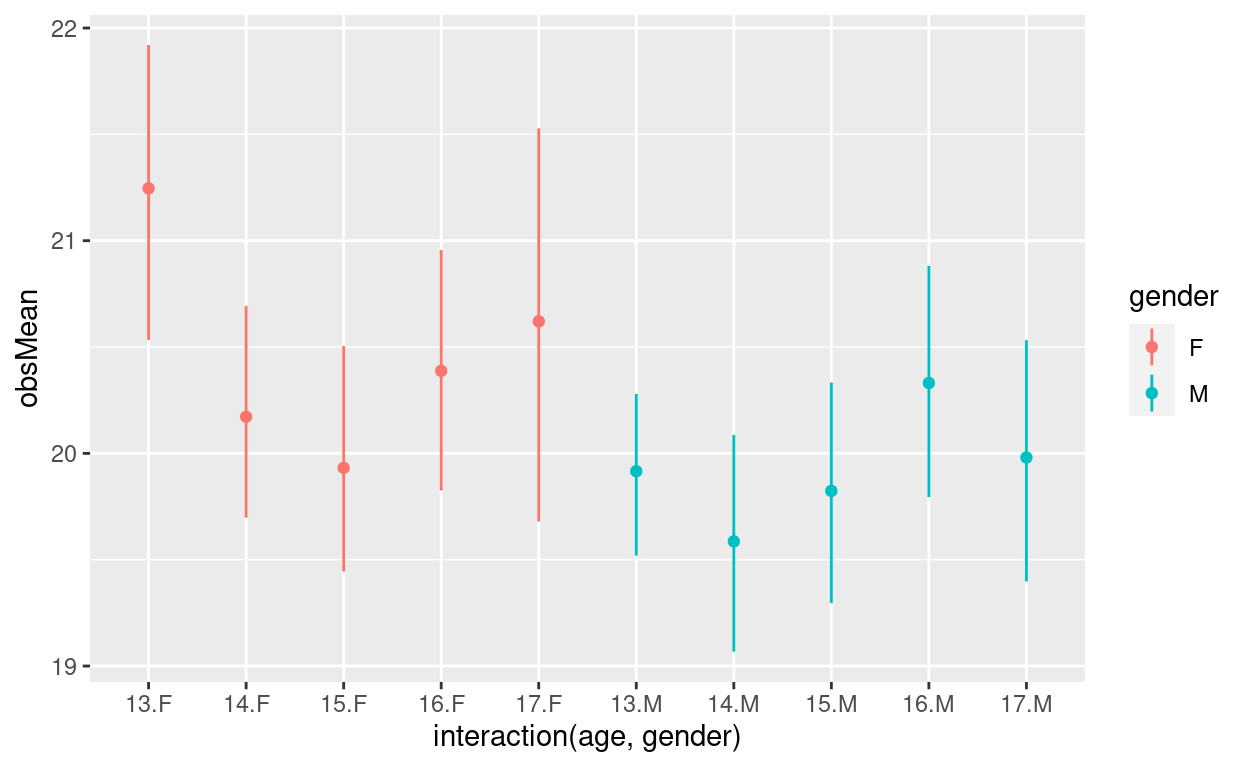
But that’s aesthetically and informatively rubbish as it’s not reflecting the grouping. I think what we want is something like this.
Show code
valXdodge = .25 # setting it here makes it easier to try different values when you have multiple geoms you want to dodge
ggplot(data = tibDat,
       aes(x = age, y = obsMean, colour = gender, group = gender)) + # key thing is that dodging is by the grouping
  geom_point(position = position_dodge2(width = valXdodge)) +
  geom_linerange(aes(ymin = LCL, ymax = UCL),
position = position_dodge(width = valXdodge)) 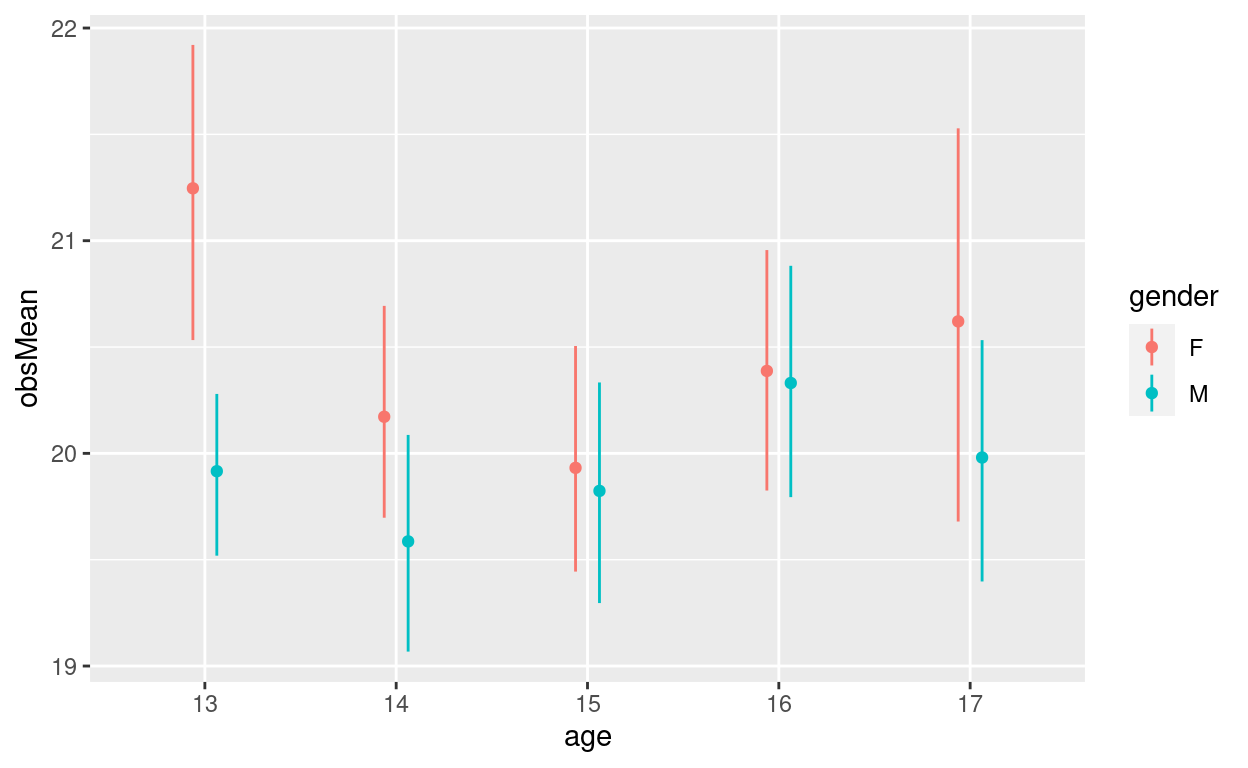
I think “nudge” would have been a much better term than “dodge” but that may be because dodging has a particular meaning in manual printing of photos (where it’s all about changing the darkness of particular areas of the image) which was something I learned about long, long ago.
I also think the help for dodge is truly awful and is compounded by the fact that dodging works differently depending on the geom you are using (I’ve been lazy and not gotten to the bottom of that but the basic issue is that it works differently for geom_bar() and geom_histogram() where I think it assumes that the x aesthetic is a grouping whereas with geom_point(), geom_linerange() and geom_errorbar() (and probably geom_line()) it needs to be told the grouping on which you are dodging.
Notwithstanding my grousing, it’s incredibly useful for depicting things. I guess it has something in common with my previous post here https://www.psyctc.org/Rblog/posts/2021-01-27-handling-overprinting/ as both tricks have in common that they actually distort the literal mappings to create mappings that are far more informative and less misleading than the simply “accurate” mapping.
web counter