
Distill
These pages have been created using the distill package in R. To quote its authors: “Distill is a publication format for scientific and technical writing, native to the web. Learn more about using Distill at https://rstudio.github.io/distill.”
That’s a pretty good summary and the documentation there covers most of the powers of Distill. However, as with much software documentation, I also felt there were things missing that I needed or that would have speeded things up for me. It’s the usual problem that the people who write the code, and many of the people who use it, are very clever and know what they are doing but don’t always remember that we’re not all that clever or that some things had become so familiar to them that they don’t notice they haven’t put those things in the documentation.
So Distill is an R package and I suppose it could be run without Rstudio but it’s clearly designed to dovetail with Rstudio. So I installed the package and followed the instructions to create a site at https://rstudio.github.io/distill/#creating-an-article. The system is as they say “a publication format” and they frame it as a tool with which to make a blog. It actually has what I would call “base pages” as well as pages that it creates as “blog posts”. It took me a while to realise that I had to create pages and posts at the command line with
distill::create_article()
and
distill::create_post() (with some arguments, pretty much all you need to do with
distill::create_post() is to give the post a title: distill::create_post("My latest post")).
The package code creates a template page which is basically Rmarkdown, just as happens when you create a new Rmarkdown page in Rstudio. You have all the usual Rmarkdown capacities: “knitting” together blocks of code and blocks of text, embedded figures, inline code in text blocks, TeX/LaTeX equation formatting inline and in equation blocks, tables, citations and reference insertion, tables of contents etc. The help at https://rstudio.github.io/distill goes through the various very nice things the templates can do for you that go a bit beyond what Rmarkdown does:
- code folding (which I have used throughout) which “folds” code away but allows the reader of the page to open it by just clicking
- nice syntax highlighting in the code blocks pretty much mimicking the syntax highlighting in Rstudio
- you can change theme with css (so I have a Rblog.css file where I’ve reset the background colour)
- footnotes
There’s a lot that has been done to make some of the things you want for open scientific/academic/research publishing easy that is set in “yaml” (a recursive acronym for “YAML Ain’t Markup Language”) … it’s a header block above the markdown/markup in many markdown/up files. My _site.yml file (as of 6.ii.21) is this:
---
name: "test2"
title: "Chris (Evans) R SAFAQ"
base_url: https://www.psyctc.org/R_blog
description: |
  CE's pages "blog posts" about using R
output_dir: "_site"
navbar:
  logo:
    image: images/g2_128.gif
    href: https://www.psyctc.org/Rblog/
    icon: images/g2_128.gif
  right:
    - text: "Home"
      href: index.html
    - text: "Welcome"
      href: "Welcome.html"
    - text: "About"
      href: about.html
    - text: "Copyright/permissions"
      href: Copyright_and_permissions.html
output:
  distill::distill_article:
    theme: Rblog.css
citations: true
cookie_consent:
  style: simple
  type: express
  palette: light
  lang: en
  cookies_policy: url
---
Let’s break that up and comment it some things that are perhaps not totally obvious. (Hm, not sure if you can comment yaml, hm, yes I think you can.)
This first block is defining the whole site.
name: "test2" # this is the directory
title: "Chris (Evans) R SAFAQ"
base_url: https://www.psyctc.org/R_blog # this makes sure the pages index to that URL
description: |
  CE's pages "blog posts" about using R
output_dir: "_site" # and this is the directory in which the site is compiled by Distill
Distill automatically creates a simple site structure with a navigation bar at the top. The next bits define that. This first bit just allows you to put an image and icon in. (I could do with a bigger one!)
navbar:
  logo:
    image: images/g2_128.gif
    href: https://www.psyctc.org/Rblog/
    icon: images/g2_128.gif
And this bit puts in links to pages you may have created with distill::create_article() … you have to put these into the navigation bar manually by putting lines like these next ones.
  right:
    - text: "Home"
      href: index.html
    - text: "Welcome"
      href: "Welcome.html"
    - text: "About"
      href: about.html
    - text: "Copyright/permissions"
      href: Copyright_and_permissions.html
output:
distill::distill_article: # not sure what this does!
theme: Rblog.css # this is where I invoke my theme/style cssThen some very nice convenience powers of the package.
citations: true # automatically inserts a nice footnote about citing things on the site
cookie_consent: # and a nice cookie consent for you
  style: simple
  type: express
  palette: light
  lang: en
  cookies_policy: url
Pages created with distill::create_article(), like all Rmarkdown, start with their own yaml blocks and again these allow some nice things.
title: "Welcome to CE blog test"
description: |
  Welcome to my blog which I hope will be useful to people using R to analyse data.
author:
  - name: Chris Evans
    url: https://www.psyctc.org/R_blog/
    affiliation: PSYCTC.org                              # put your affiliation/organisation in
    affiliation_url: https://www.psyctc.org/psyctc/      # URL for that
    orcid_id: 0000-0002-4197-4202                        # put your ORCID ID in
date: "2024-04-09"
output:
  distill::distill_article:
    self_contained: false
Automate transfer to my web server
This took me some hours today to sort out but will save me many hours over the years ahead. I suspect that anyone who is more familiar with git than I was will manage to do this much more quickly than I did. What I’ve done is:
- install git on the machine on which I’m running Rstudio and storing the site pages
- tell Rstudio that git is there and is to be used for “version control”, i.e. automatic backing up of all changes that you “commit” keeping a full historical archive of the changes
- created a free personal account on gitHub (https://github.com/cpsyctc/) and create a respository in it (https://github.com/cpsyctc/Rblog)
- created a personal token which works instead of a password to log into my repository there and makes sure that I’m the only one who can write things to that repository (but anyone can download, “pull” in git terminology, from it) (I have now discovered from https://usethis.r-lib.org/reference/use_github.html that these bits might have bee expedited with a )
- use that to “push” each new committed update to the pages to that github repository
- install git on my web server (pretty sure my ISP had already done this actually)
- [this bit, and the next, are linux specific but could be done, though the terminology is different, in Windoze] create a little shell script on the server that “pulls” a copy of the repository content down to the server from github (git handles the tracking of changes and makes sure that only the minimum necessary material is stored and transferred) and uses rsync to copy things to the web pages (rsync, a bit like git, will only copy changed files)
- put a call into crontab to run that little script every ten minutes
So I’ve now got a site/blog developing here as an Rstudio project that I can commit and push to github (where anyone can pull it if they want it) and which then automatically updates my server, at slowest, ten minutes later.
Now I need to spend a bit more time creating more content but perhaps I’ll browse some other people’s examples first: see https://pkgs.rstudio.com/distill/articles/examples.html.
How to get images into the preview
[Added 7.ii.21] I couldn’t work out how to get an ordinary image into listing of “posts” in the base of the “blog” but, courtesy of Shannon Pileggi of the excellent https://www.pipinghotdata.com/ site she created with Distill, I now have the trick: put the graphic in the directory holding the post and put a line in the yaml pointing to it. So here’s the YAML header of the Rmarkdown file that creates this page:
---
title: "How I've done this"
description: |
  Just documenting how I have created these pages
base_url: https://www.psyctc.org/psyctc/Rblog/
preview: distill.png
author:
  - name: Chris Evans
    url: https://www.psyctc.org/R_blog/
    affiliation: PSYCTC.org
    affiliation_url: https://www.psyctc.org/psyctc/
    orcid_id: 0000-0002-4197-4202

date: 2021-02-06
output:
  distill::distill_article:
    toc: true
    toc_depth: 3
    self_contained: false
---
You see the crucial preview: distill.png (I downloaded the graphic from https://blog.rstudio.com/2020/12/07/distill/distill.png). That’s it: thanks Shannon! Shannon also pointed me to her public github repository at https://github.com/shannonpileggi which has all the code for her blog at https://github.com/shannonpileggi/pipinghotdata_distill … I should have been able to find that without Emailing her.
How to get wider images
This is from https://rstudio.github.io/distill/figures.html. You use a “layout=” argument in the code block header.
The default format is l-body so the code block header:
```{r codeBlock}
is the same as:
```{r codeBlock, layout="l-body"}
Wider layouts are l-body-outset, l-page and l-screen. Let’s see!
Default plot width: l-body
```{r plotECDFwithCIquantiles1, layout="l-body"}

Wider plot width: l-body-outset
```{r plotECDFwithCIquantiles2, layout="l-body-outset"}

Wider plot width still: l-page
```{r plotECDFwithCIquantiles3, layout="l-page"}
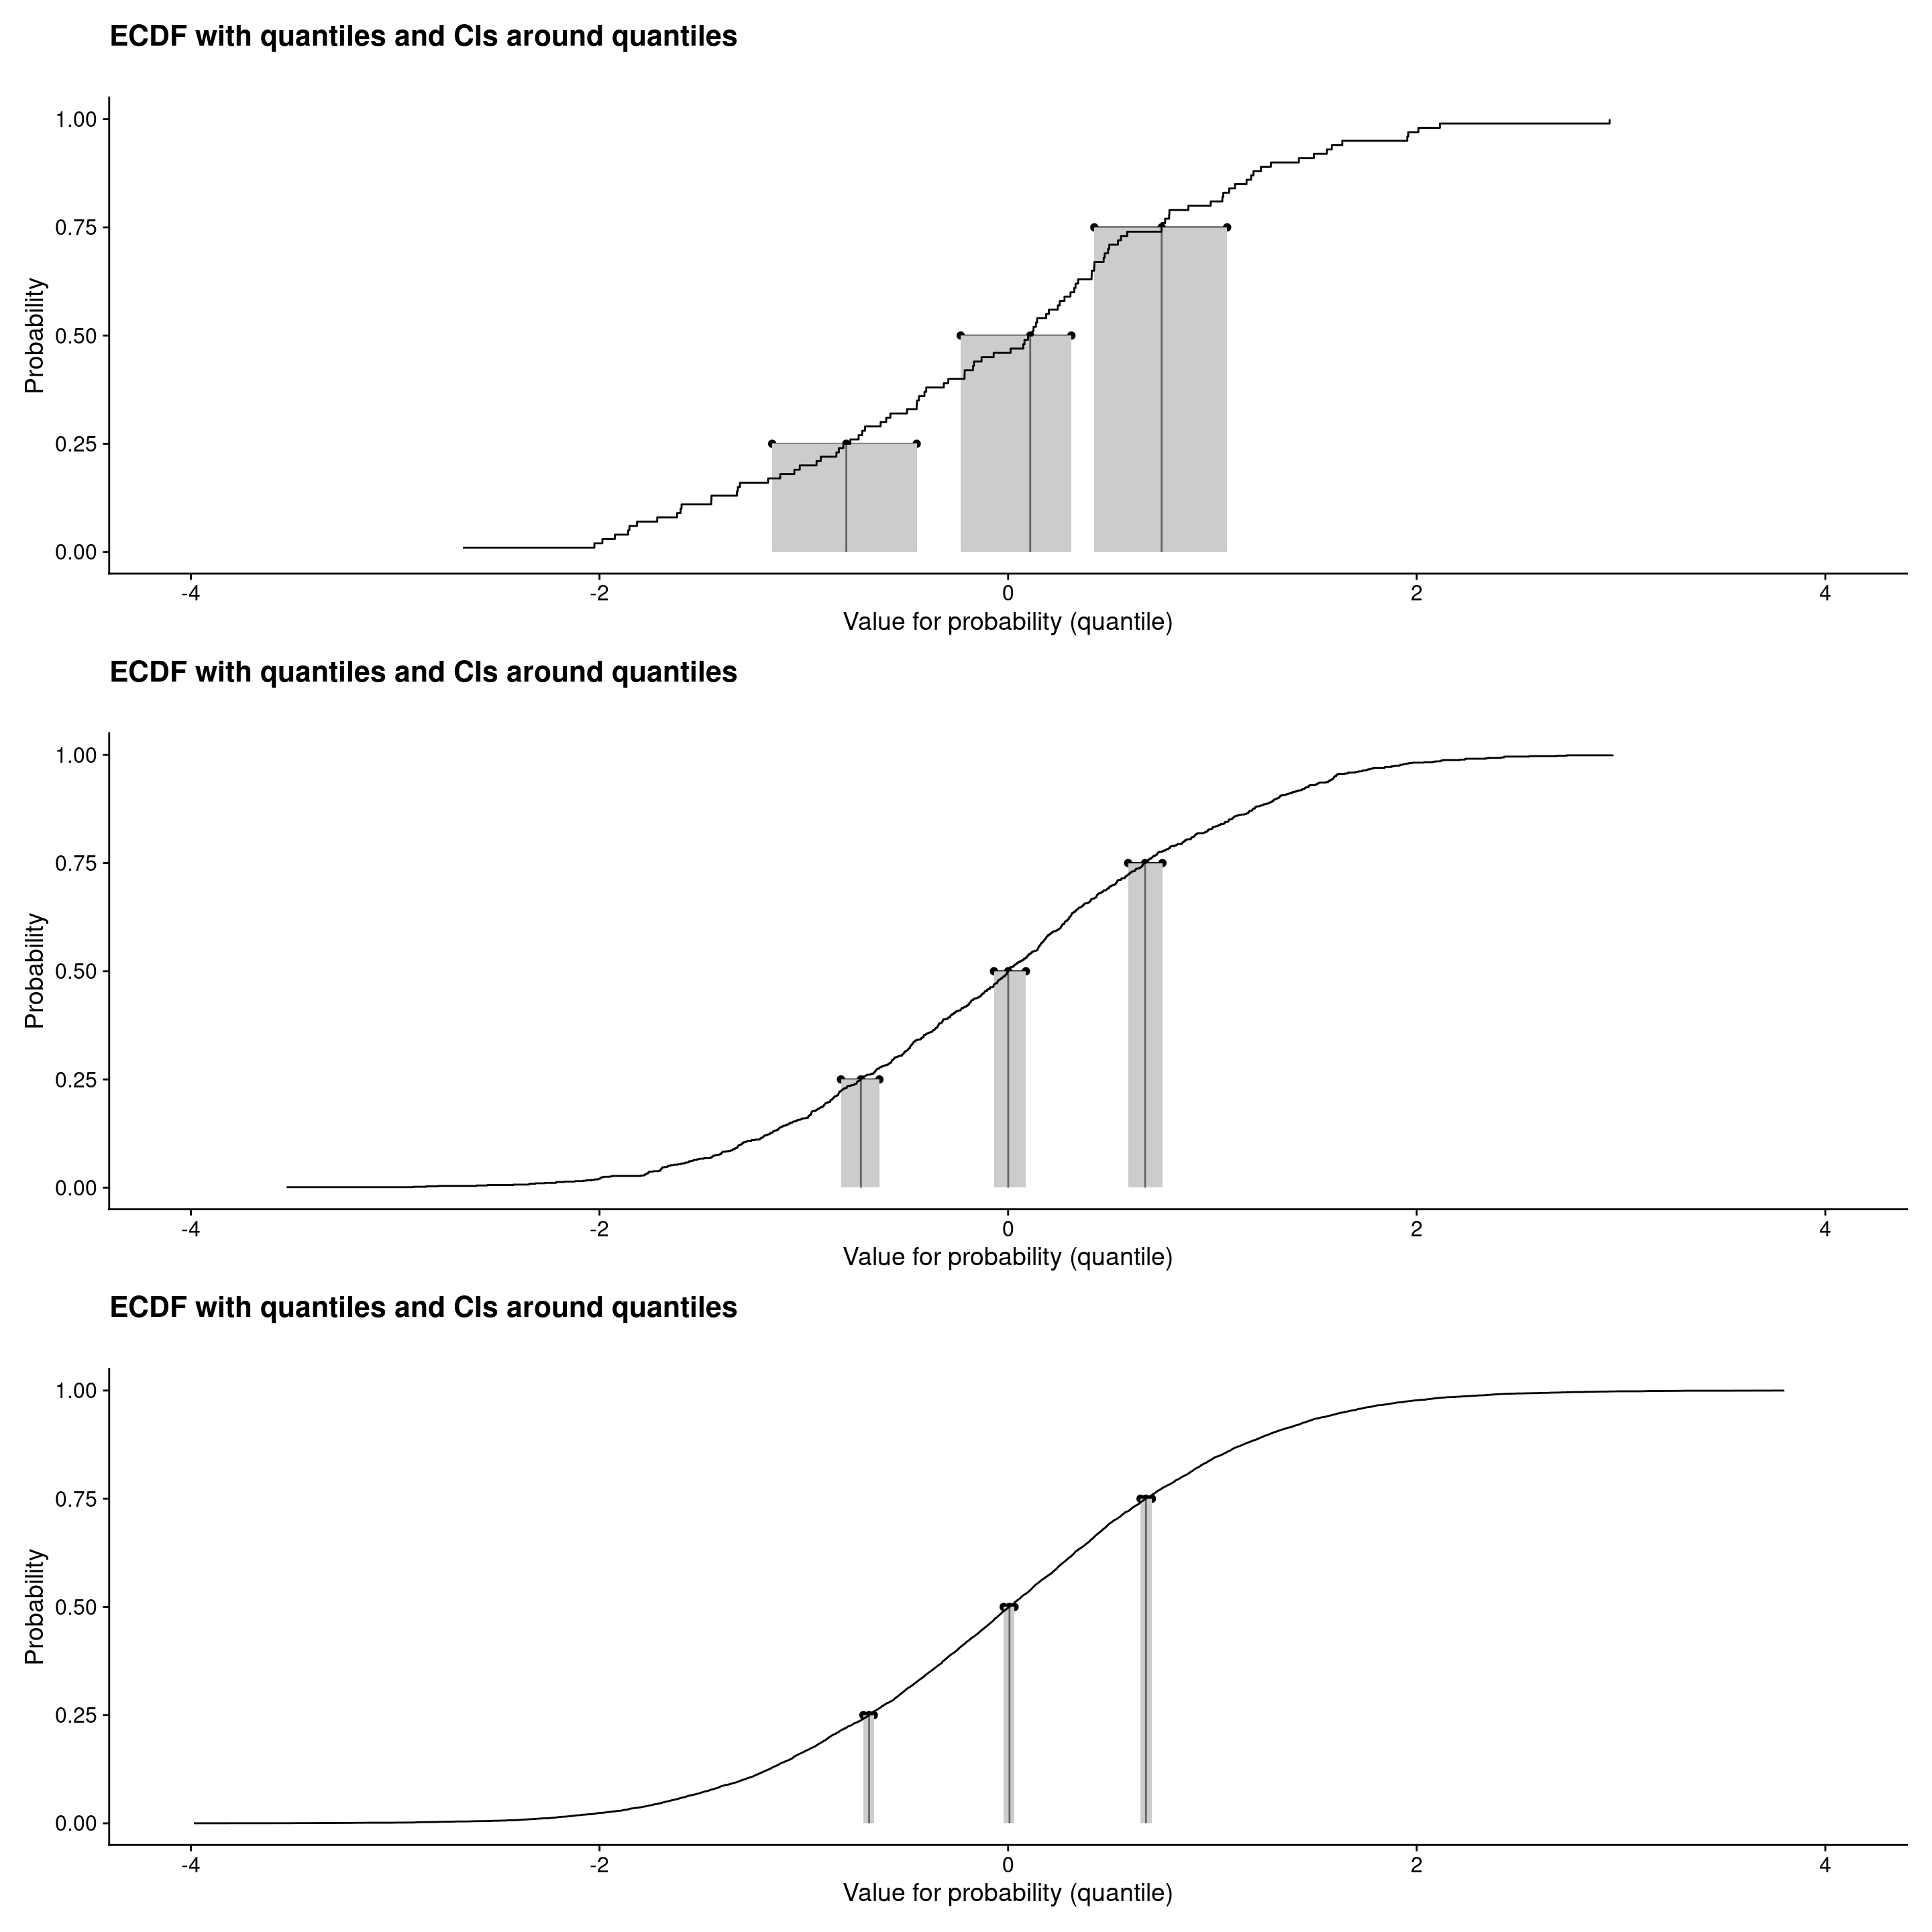
Full screen: l-screen
```{r plotECDFwithCIquantiles4, layout="l-screen"}

Those were ECDF plots showing confidence intervals around the observed quartiles (and median) see Rblog post: Confidence intervals for quantiles. Plots created using plotQuantileCIsfromDat() from the CECPfuns package.
web counter