This came out of writing the entry for convergent validity in my glossary for the OMbook.
I am using data from my work with my excellent colleagues in UDLA (Universidad de Las Américas) in Quito, Ecuador. The data comes from two clinics in Quito.
Non-linearity
This is the issue Statistics/psychometrics II in the glossary entry. Too often we see convergent validity reported with a correlation but no scattergram and, though it doesn’t render the correlation useless this can hide non-linearities in the mapping from the one measure to the other. Pressures on plot space in articles militates against showing scattergrams for convergent correlations particularly when there may be a number in the one report. As it becomes more usual to have supplementary materials in online repositories that will last decades at least we should start to see these plots and exploration of possible non-linearities.
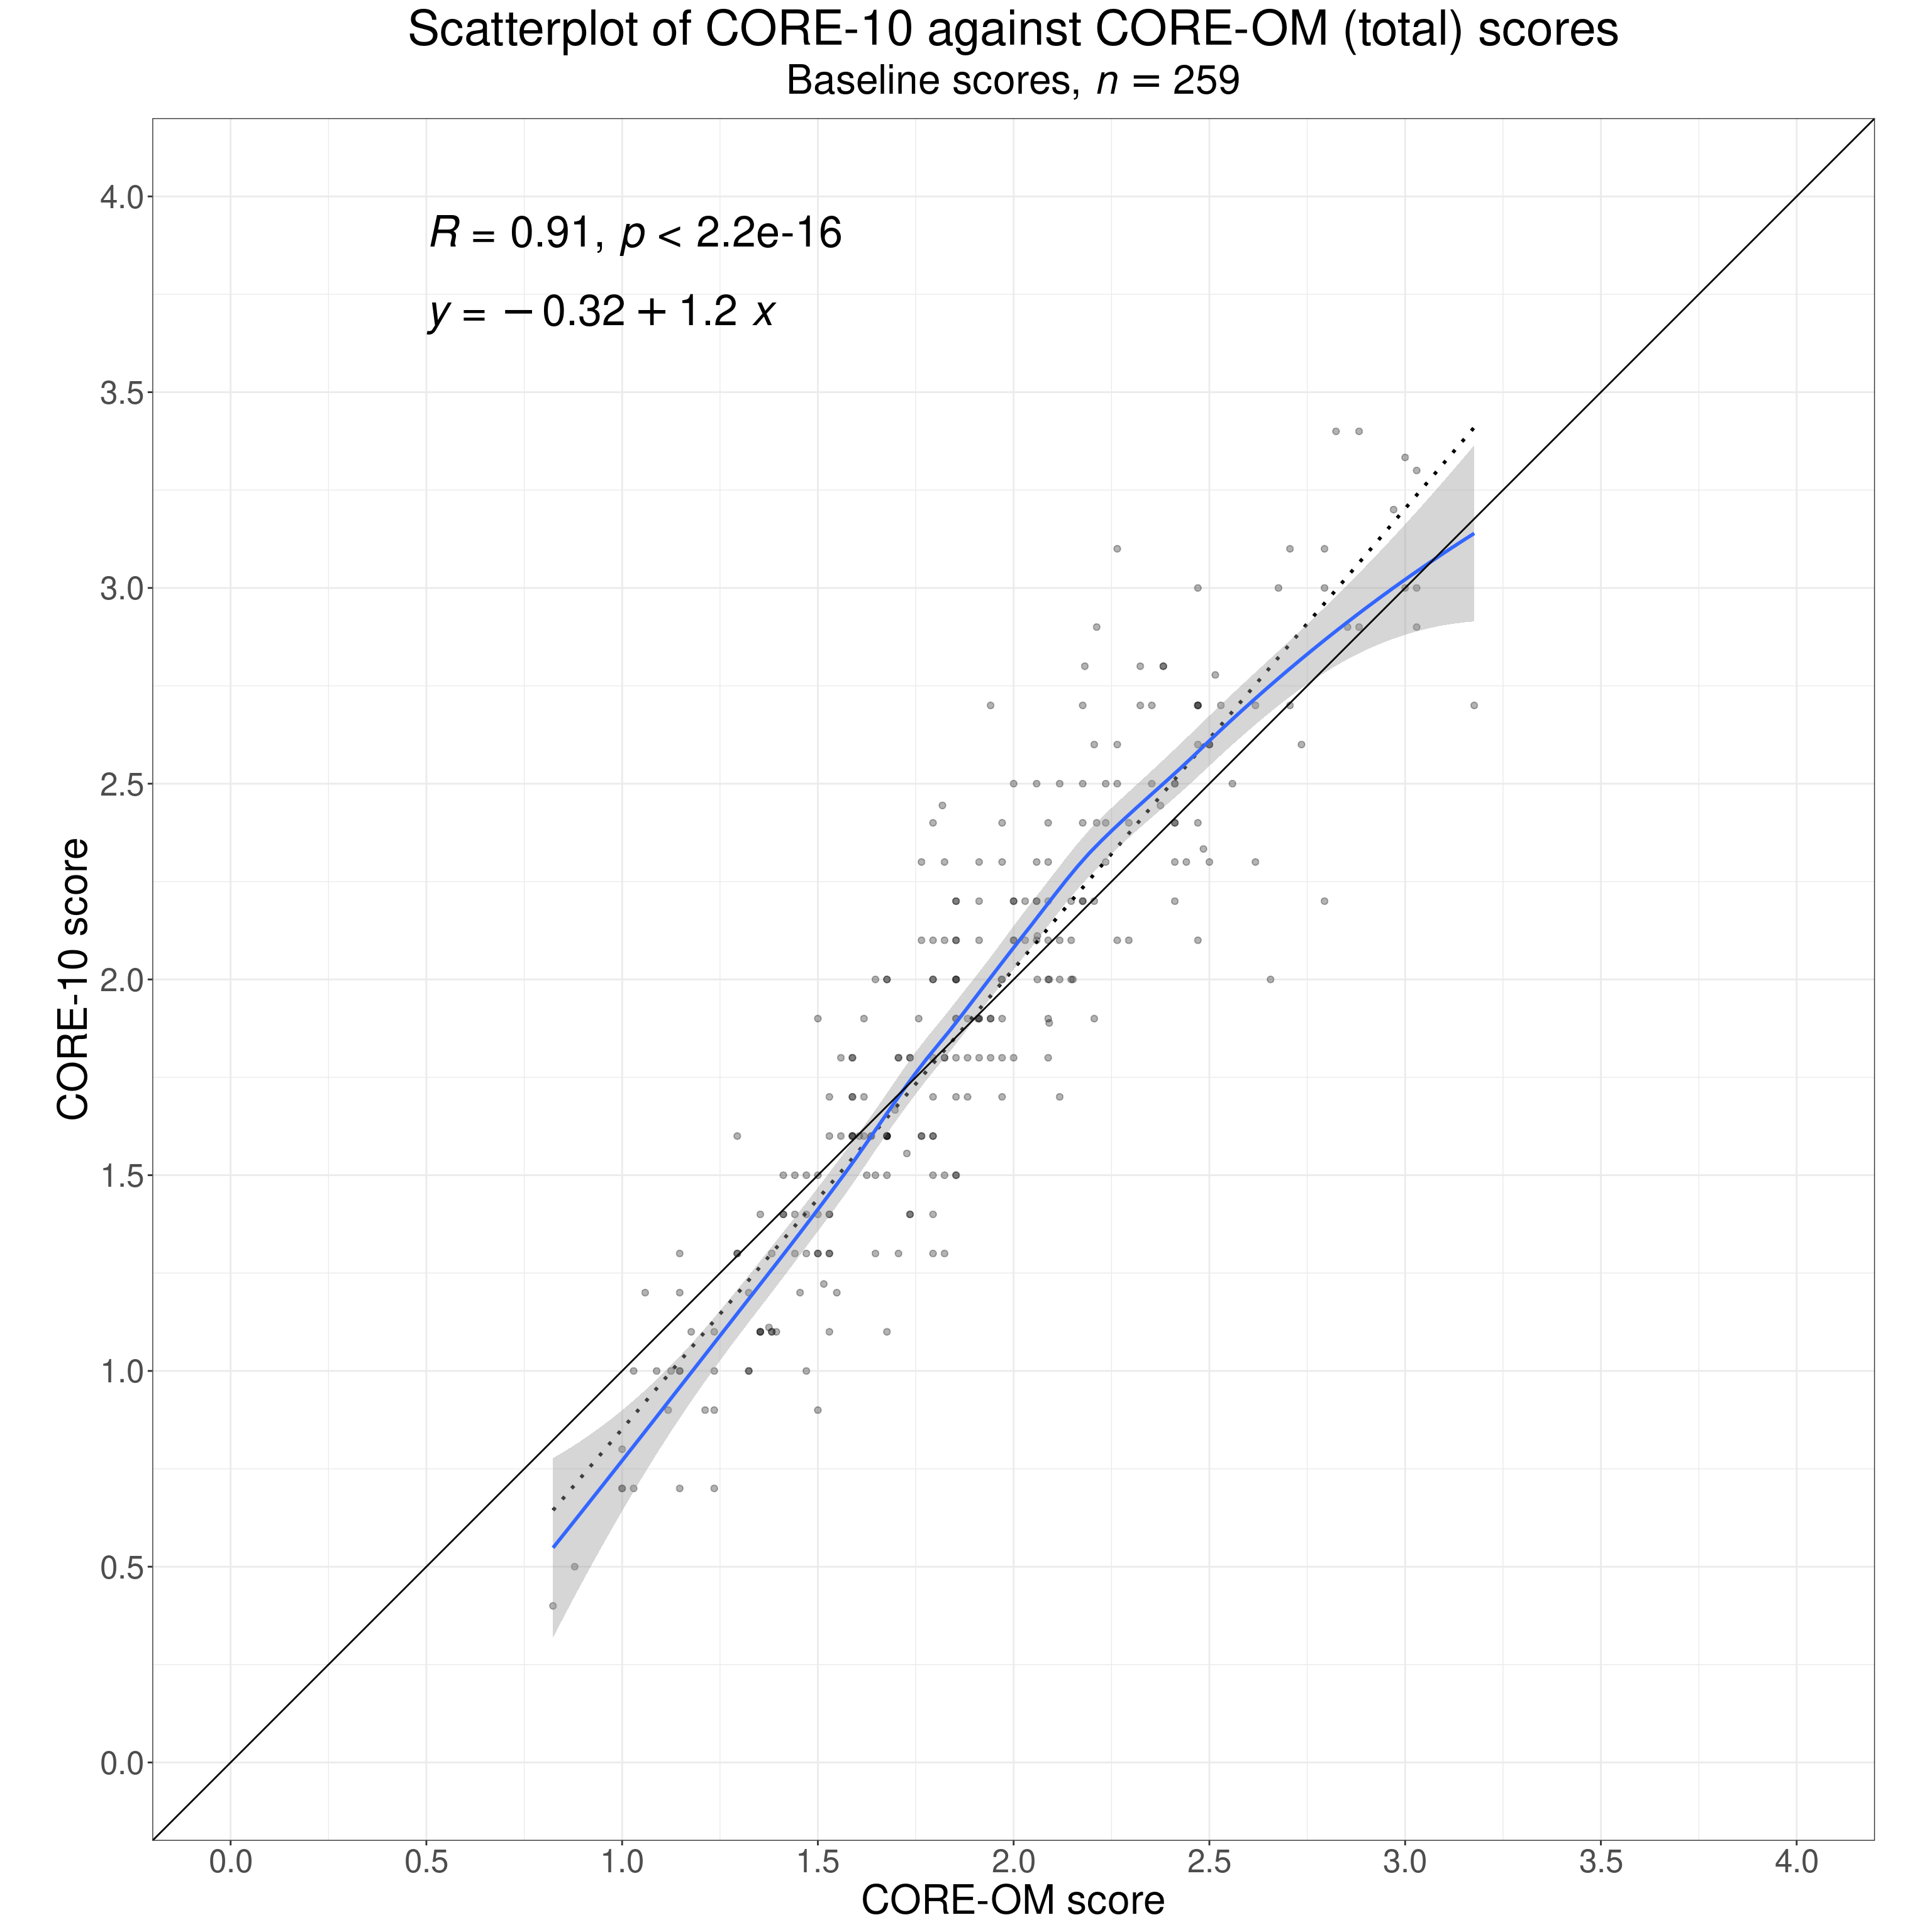
This shows one way to explore non-linearity. It’s the mapping of first contact CORE-10 scores onto CORE-OM scores.
Show code
load(paste(postDir, "tmpTibJC", sep = "/"))
load(paste(postDir, "tmpTibJCfirst", sep = "/"))
load(paste(postDir, "tmpTibJC14plus", sep = "/"))

n_distinct(tmpTibJCfirst$id) -> tmpNall

ggplot(data = tmpTibJCfirst,
       aes(x = score, y = score10)) +
  geom_point(alpha = .3) +
  geom_smooth(method = "lm",
              se = FALSE,
              colour = "black",
              linetype = 3) +
  stat_regline_equation(label.x = .5, label.y = 3.7,
                        aes(label = after_stat(eq.label)),
                        size = 9) +
  stat_cor(label.x = .5, label.y = 3.9,
           size = 9) +
  geom_smooth() +
  geom_abline(intercept = 0, slope = 1) +
  scale_x_continuous("CORE-OM score",
                     breaks = seq(0, 5, .5),
                     limits = c(0, 4)) +
  scale_y_continuous("CORE-10 score",
                     breaks = seq(0, 5, .5),
                     limits = c(0, 4)) +
  coord_equal(ratio = 1) +
  ggtitle("Scatterplot of CORE-10 against CORE-OM (total) scores",
          subtitle = expression("Baseline scores," ~italic("n") ==  259))
Show code
# ggsave(filename = "convergent_validity1.png", width = 3000, height = 3000, units = "px")

tmpTibJCfirst %>%
  summarise(corr = list(getBootCICorr(score ~ score10,
                                 pick(everything())))) %>%
  unnest_wider(corr) -> tmpTibCorr
That has the perfect regression line y = x as the solid diagonal line and the best fitting linear regression is show by the dotted line whose Pearson correlation and p value are shown as is the linear regression equation. The regression slope is 1.2, not too far off 1.0, and the intercept is -.32, not far off zero.
There’s also a very strong correlation there of .91. (There should be: all the items of the CORE-10 are embedded in the CORE-OM so this isn’t a typical convergent validity study, but it illustrates the principles.) Of course it’s highly statistically significant! More important is that the 95% bootstrap correlation interval around the observed correlation is from 0.88 to 0.93 so it’s quite well estimated given the n of 259.
We can probably reasonably assume that this a fairly representative guide to the convergent validity correlation between the two measures for scores at arrival at these clinics in Quito. We should of course be cautious about assuming anything about generalising from this correlation to use of the same two measures in other populations: as ever, psychometric statistics for our measures are not properties of the measures, they are properties of the scores in these data.
As our saying (Clara’s and mine) goes: “questionnaires are not blood tests”. That’s essentially the title of our paper: Paz, C., Adana-Díaz, L., & Evans, C. (2020).
Clients with different problems are different and questionnaires are not blood tests: A template analysis of psychiatric and psychotherapy clients’ experiences of the CORE‐OM. Counselling and Psychotherapy Research, 20(2), 274–283. https://doi.org/10.1002/capr.12290.
(That’s not open access, DO contact me if you want a copy but remember to tell me what it is you want, the contact form doesn’t tell me.)
However, what is clear from the smoothed regression line in blue and its 95% confidence interval in grey, is that the relationship between the two scores is not perfectly linear: the smoothed regression falls below the linear regression both at the bottom and the top of the observed score range and at the top the confidence interval around the smoothed regression clearly falls below the best fitting linear regression.
This is not fatal: of course we have superb convergent validity here (as there should be …!). However, it warns us that taking a 1:1 mapping from the one measure to the other is going to lead to some mismapping and if we really need to map from scores on the one measure to scores on the other across multiple people completing the measures then some non-linear mapping might achieve a more accurate mapping.
However, as I said in the glossary entry, there is another issue.
Individual differences
That was the convergent validity correlation, and then a more detailed exploration of the mapping between the measures across individuals. However, it is not necessarily true that a relationship between the measures across independent individuals will be the same as that across completions by the same individual over time. As I put it in the glossary:
Two measures may correlate well across individuals but if a client in therapy completes both measures every session within a therapy but one measure focuses a bit more on issues that concern that individual than the other and if those are the issues that improve across that therapy then the correlation between the two measures across the repeated completions may be quite low, for another client there may be no particular difference in the pertinence of the items on the measures and the correlation of their scores across the therapy may be high, similar to or even higher than the across client “convergent validity” correlation for the two measures. These facts don’t mean that looking at across individual convergent validity correlations are bad ways to explore the relationships between measures, just that we should always remember that our multi-item measures are not physical science measures and that humans’ responses to measures are active not passive.
This shows the reality of that from the same routine dataset. Clearly, we need quite a few complete scores from each client in order to be able to assess if the correlations for some of the individuals differ from those from some of the others.
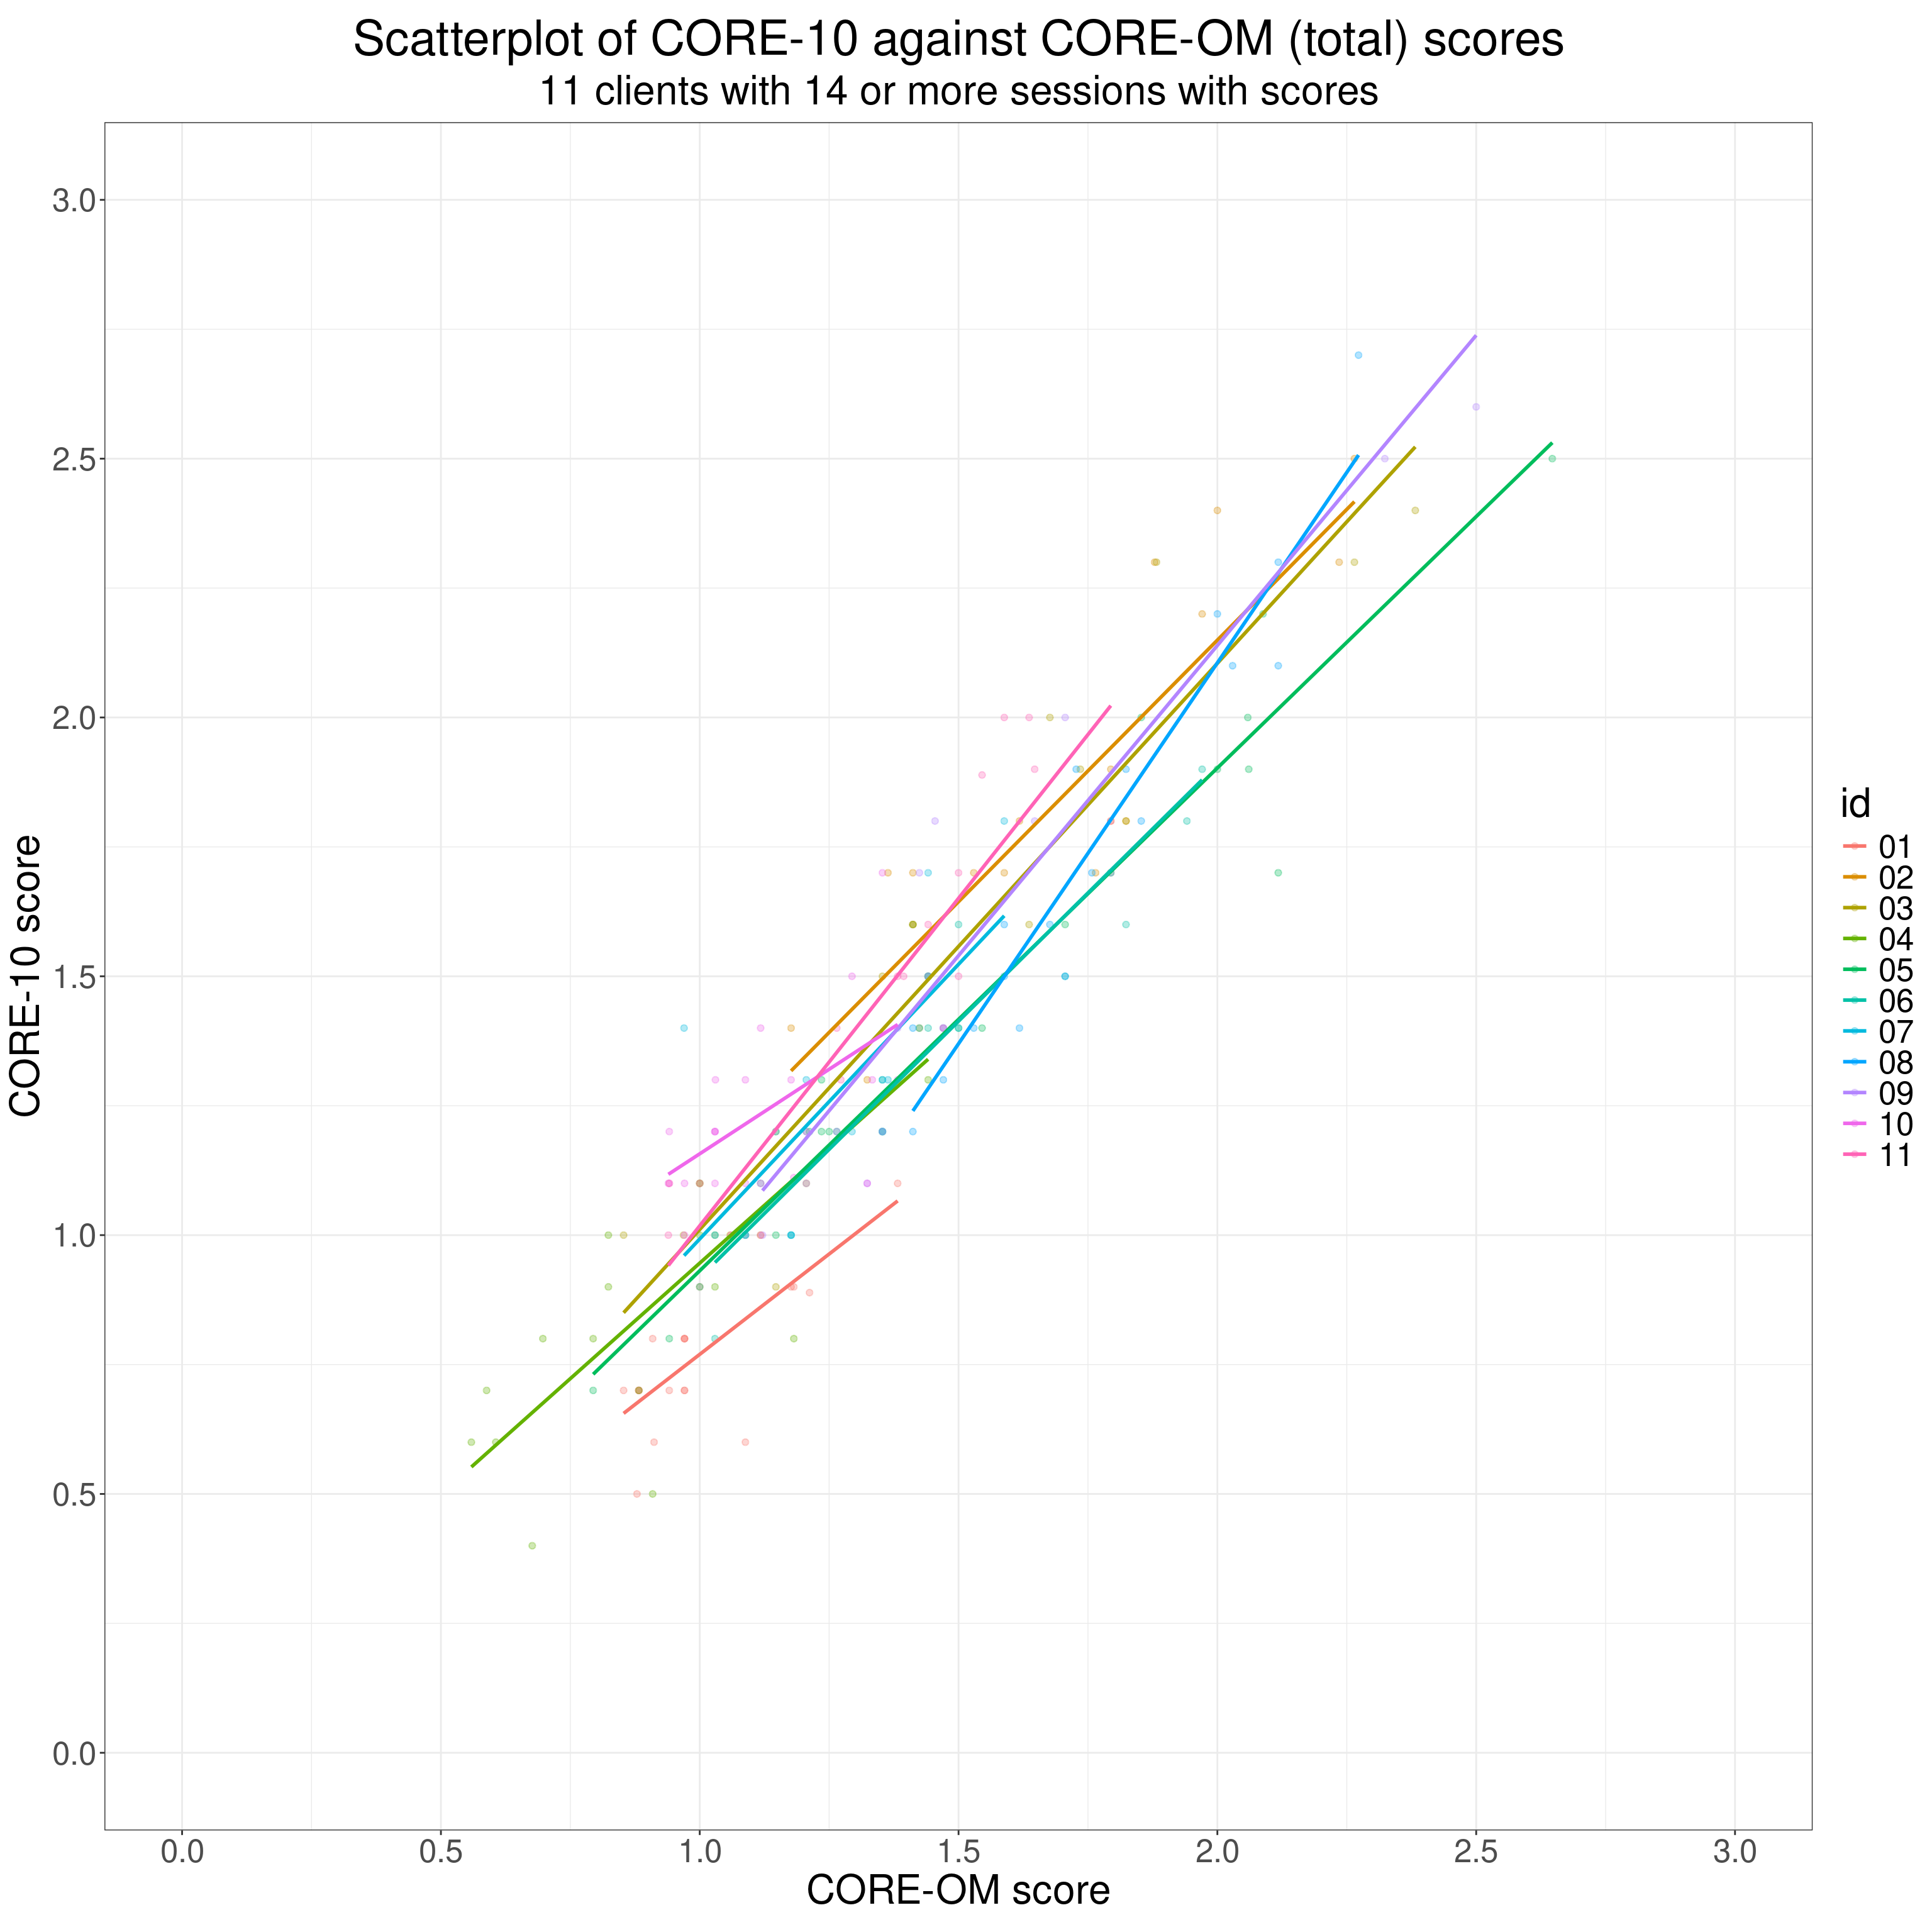
This shows the scattergram coloured by id code for all the complete scores from the eleven clients with 14 or more pairs of scores.
Show code
n_distinct(tmpTibJC14plus$id) -> n14plus

ggplot(data = tmpTibJC14plus,
       aes(x = score, y = score10, colour = id)) +
  geom_point(alpha = .3) +
  geom_smooth(method = "lm",
              se = FALSE) +
  scale_x_continuous("CORE-OM score",
                     breaks = seq(0, 3, .5),
                     limits = c(0, 3)) +
  scale_y_continuous("CORE-10 score",
                     breaks = seq(0, 3, .5),
                     limits = c(0, 3)) +
  coord_equal(ratio = 1) +
  ggtitle("Scatterplot of CORE-10 against CORE-OM (total) scores",
          subtitle = "11 clients with 14 or more sessions with scores")
Show code
# ggsave(filename = "convergent_validity2.png", width = 3000, height = 3000, units = "px")It’s hard to tell from that but it though it looks as if the correlations between the scores on the measures are all positive it also looks as if the correlations, and the regressions, do show quite a bit of variety across the eleven people.
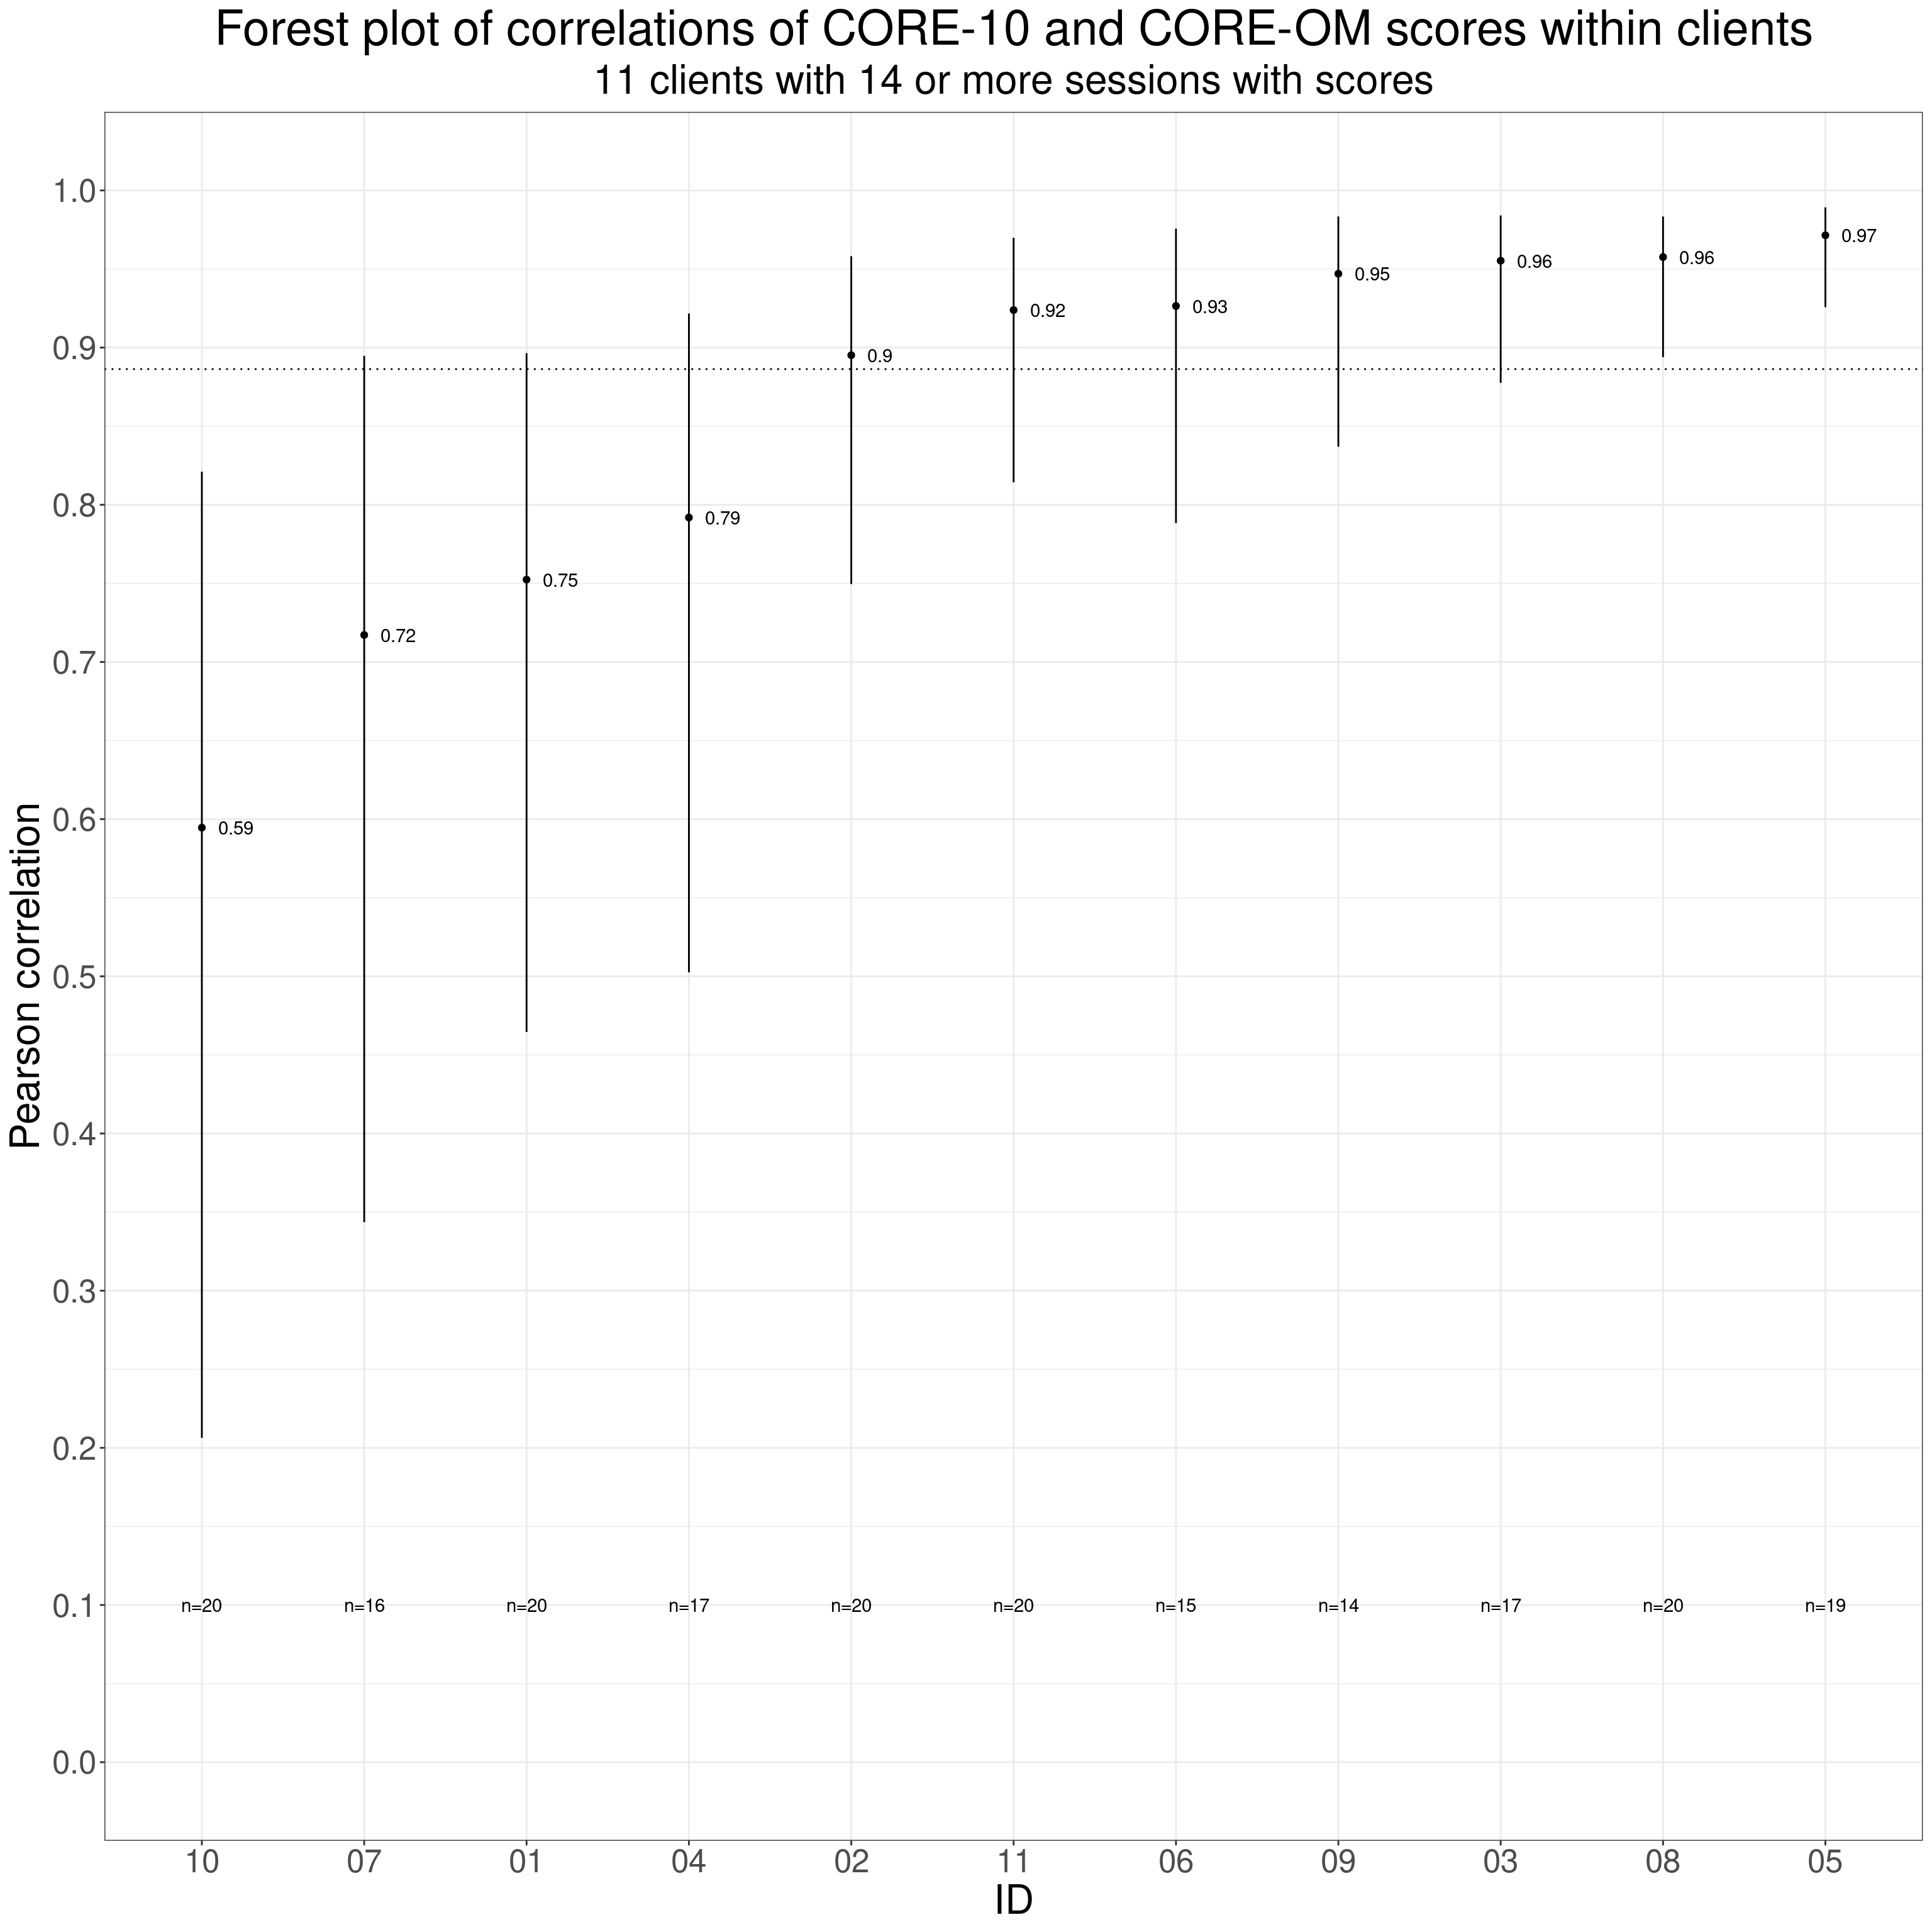
This next plot is a forest plot of the correlations per client with their 95% confidence intervals (those are parametric estimates, i.e. assuming Gaussian distributions of scores: the numbers of completions per client are really too small to get robust bootstrap estimates).
Show code
tmpTibJC14plus %>%
  filter(occasion == 1) %>%
  summarise(corr = cor(score, score10),
            SD10 = sd(score10),
            SDOM = sd(score)) -> tmpTibSummary

tmpTibSummary %>%
  select(corr) %>%
  pull() -> tmpBaselineCorrAll14


tmpTibJC14plus %>%
  group_by(id, nSessions) %>%
  summarise(corr = cor(score, score10),
            SD10 = sd(score10),
            SDOM = sd(score)) %>%
  ungroup() %>%
  rowwise() %>%
  mutate(ciCorr = list(getCIPearson(r = corr, n = nSessions))) %>%
  ungroup() %>%
  unnest_wider(ciCorr) -> tmpTibCorrs


ggplot(data = tmpTibCorrs,
       aes(x = reorder(id, corr),
           y = corr)) +
  geom_point() +
  geom_linerange(aes(ymin = LCL, ymax = UCL)) +
  geom_hline(yintercept = tmpBaselineCorrAll14,
             linetype = 3) +
  geom_text(aes(label = round(corr, 2)),
            nudge_x = .1,
            hjust = 0) +
  # geom_text(aes(label = nSessions,
  #               y = LCL),
  #           nudge_y = -.03,
  #           hjust = 0.5) +
  geom_text(aes(label = paste0("n=", nSessions),
                y = .1),
            # nudge_y = -.03,
            hjust = 0.5) +
  xlab("ID") +
  scale_y_continuous("Pearson correlation",
                     breaks = seq(0, 1, .1),
                     limits = c(0, 1)) +
  ggtitle("Forest plot of correlations of CORE-10 and CORE-OM scores within clients",
subtitle = "11 clients with 14 or more sessions with scores") 
Show code
# ggsave(filename = "convergent_validity3.png", width = 3400, height = 3400, units = "px")The observed correlations are shown as the points (labelled with the values) and the confidence intervals are, of course, the vertical lines. The numbers of completed measures per client are shown at the bottom of the plot. The dotted horizontal reference line is the across individuals correlation across the first completions for these eleven clients.
It’s clear that there is a considerable spread in the observed correlations and that the parametric confidence intervals suggest that the within-person correlation for ID 10 is well below, probably statistically significantly, below that first contact across individuals correlation (as the vertical line doesn’t cut the dotted reference line) and those for IDs 08 and 05 are above that correlation.
We can conclude that within individual correlations vary across individuals and that some are clearly different from the usual single completion, single point in time convergent validity correlation.
Conclusion
None of this is to reject computation of convergent validity correlations across individuals (but please, don’t give us daft p values for those correlations): they are genuinely useful, the higher they are the better the convergent validity. Instead of giving us p values give us confidence intervals around the observed values: that will tell us how precisely they estimate a population value (assuming that the sample/dataset can be seen as representative of the population).
This post also reminds us that a simple correlation may hide non-linear relationships between the two scores which may matter, or not, depending on the likely use of the measures.
Finally it reminds us that the conventional correlation across individuals cannot guarantee that the same correlations will be seen across repeat completions within individuals over time. Again, whether that matters or not is an issue about what we are going to read into scores within individuals’ trajectories of change.
Recommendations
- Don’t use the NHST and p values for convergent validity correlations: they don’t tell us anything useful.
- DO use 95% confidence intervals around your observed correlations: they do tell us something useful about how precisely your data have allowed you to estimate a possible population correlation …
- … but please be sensible and not pretend that findings were from a random sample from a defined population (as they almost certainly weren’t). Say what seem to be sensible populations to generalise to and what are less so and what populations really need their own data for us to know how the measures correlate there. These limitations should be framed not as virtue signalling but as sensible cautions and indications for further research.
- Whether in a supplementary document or in the report itself do show a scattergram for the relationship between your two sets of scores, show it with the y = x diagonal, the best fit linear regression and some sensible (loess?) smoothed regression so we can see if there seem to be marked non-linearities in the relationship between the scores.
- If you can get multiple completions (n > 8) within at least some individuals do explore whether there are clear individual differences in the correlations/regressions linking the two sets of measure scores within individuals from the across individuals relationship and to see if there is heterogeneity across the individuals from whom you managed to get these multiple completions.
Punchline!
The psychometric properties of questionnaires really are not the measurement properties of blood tests!
hits counter