Part of concurrent validity (q.v.). Convergent validity is evidence that data from a measure correlate (strongly) with data obtained at the same time as the measure scores but on some other variable that theory says should correlate positively with the measure scores. Typically, convergent validity will be against another measure of the same concept but in theory it could also
Details #
What follows is expanded, with R code and recommendations, in my Rblog post: convergent validity issues (1).
Background #
In the physical sciences it is often the case that convergent validity is explored for a new, cheaper, quicker, or more robust test against a “gold standard” referential measure where that referential status may be quite formally about it being demonstrable that that measure is definitive or, if still ratified by some commission, the logic of the status of the measure is clear: all the Système International measures of things like length, time, mass etc. fall into such categories. As so often, the wikipedia article on the SI is good if you want to know more about that.
However, our realm is not like that: measures of things in the inner world of the mind only get to be referential measures by dominant use (though sadly edicts seem to emerging which seems a very dodgy development probably driven by the craving to have measurement that equates with that of the physical sciences). If restricting ourselves to multi-item measures we do have a distinction between longer and shorter measures and it is often going to be the case that the longer measure is more “referential” and the shorter measure more practical for many applications so exploring the convergent validity of the shorter measure against the longer one is important and useful.
Statistics/psychometrics I #
Why “strongly” above? Because for decades explorations of convergent validity have claimed to have “validated” measures by reporting correlations between two measures and reporting whether the correlation is statistically significant. This is nonsense! If the measures have convergent validity whether their correlation in that sample is unlikely to have arisen by chance at p < .05 is not interesting: if that’s in question we really have no faith in our measures at all. What matters is whether the correlation between the two measures is really strong. We know our measures are not perfect so we are not expecting to see a correlation of 1.0 but we want a really strong correlation if we are to use the one measure as a pragmatic alternative to the other.
So how strong is “strongly enough”? Well it depends what use you want to make of the newer measure. If you are going to be able to collect a lot of data with it affordably and practically and you want to test whether the measure, say of “interpersonal trust” shows a difference (in mean score) between a sample of people who have seem to have been abused in childhood and a sample who seem not to have been abused then even a very poor correlation, say a Pearson correlation of .6 would be more than sufficient to retain strong statistical power to detect what you might presume to be a very strong population effect (say a power of 80% to detect a mean difference using the conventional criterion alpha of .05) assuming that you can get samples larger than say 80 per group. On the other hand, if you want to screen for say “depression” and you want to take known discriminating strength of the longer measure and assume that the same applies for the new measure you want correlations over .90. (Yes, I have reservations about the diagnostic paradigm but it’s much used.) It’s time we reduced use null hypothesis significance testing (NHST) but for convergent validity it’s time it was buried with a long stake through its p values!
Statistics/psychometrics II #
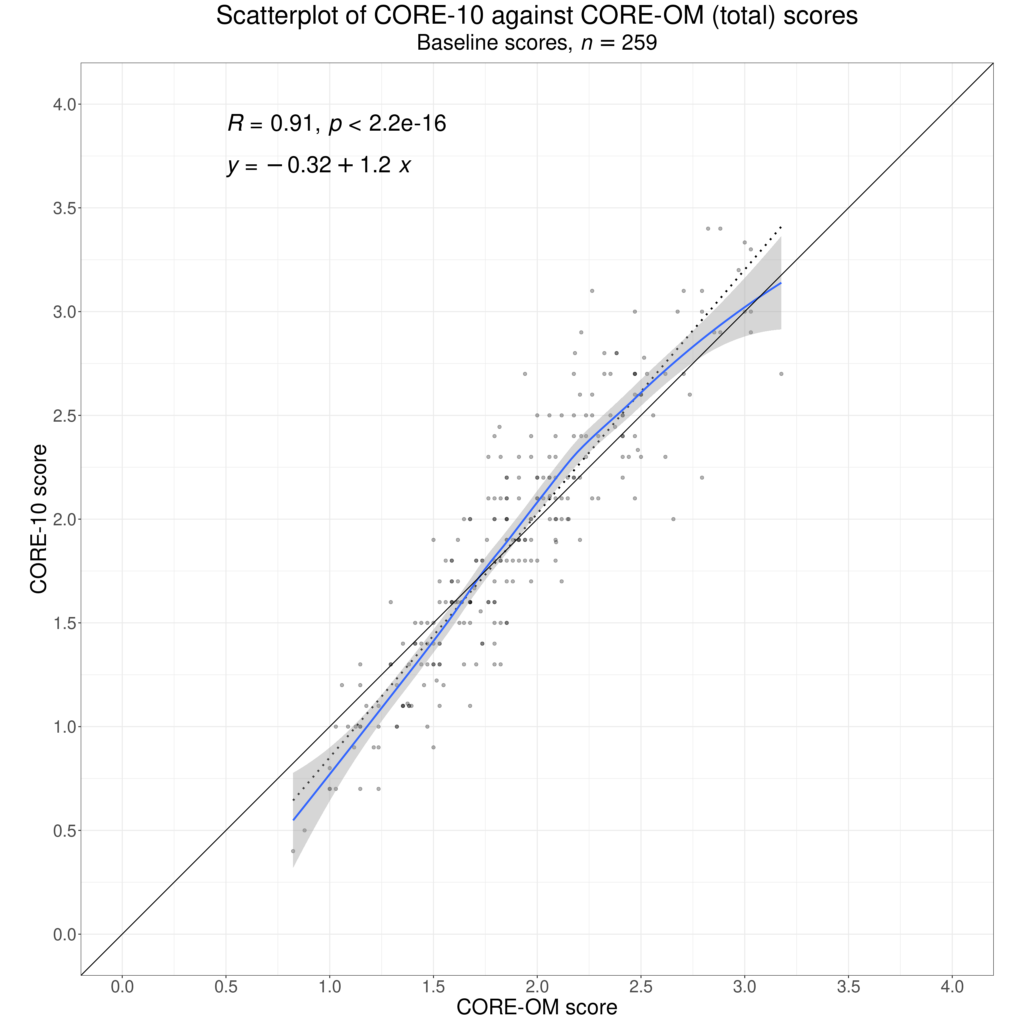
This is a lesser plea, but please can we see scattergrams and some smoothed regression plot when people report convergent validity? Just because there’s a strong correlation, whether a Pearson or a non-parametric Spearman or Kendall coefficient, it doesn’t follow that the relationship is linear and if it’s not a linear mapping from the one score to the other we need to know that and think what to do about it if mapping from one set of scores to another. Non-linear relationships are not at all implausible as measures are often “tuned” to different levels of severity.
Here’s an example showing some non-linearity in the relationship between the scores on two measures. More detail on that in the Rblog post.
Statistics/psychometrics III #
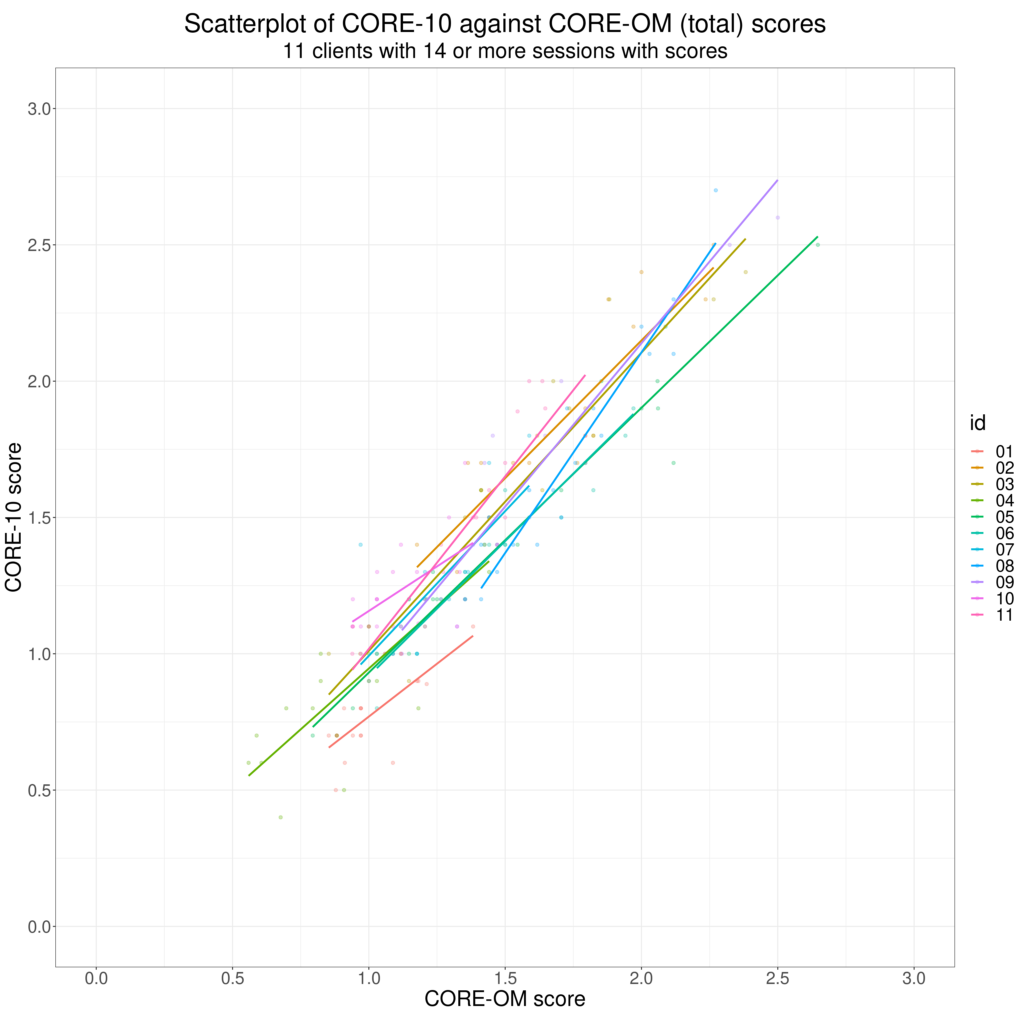
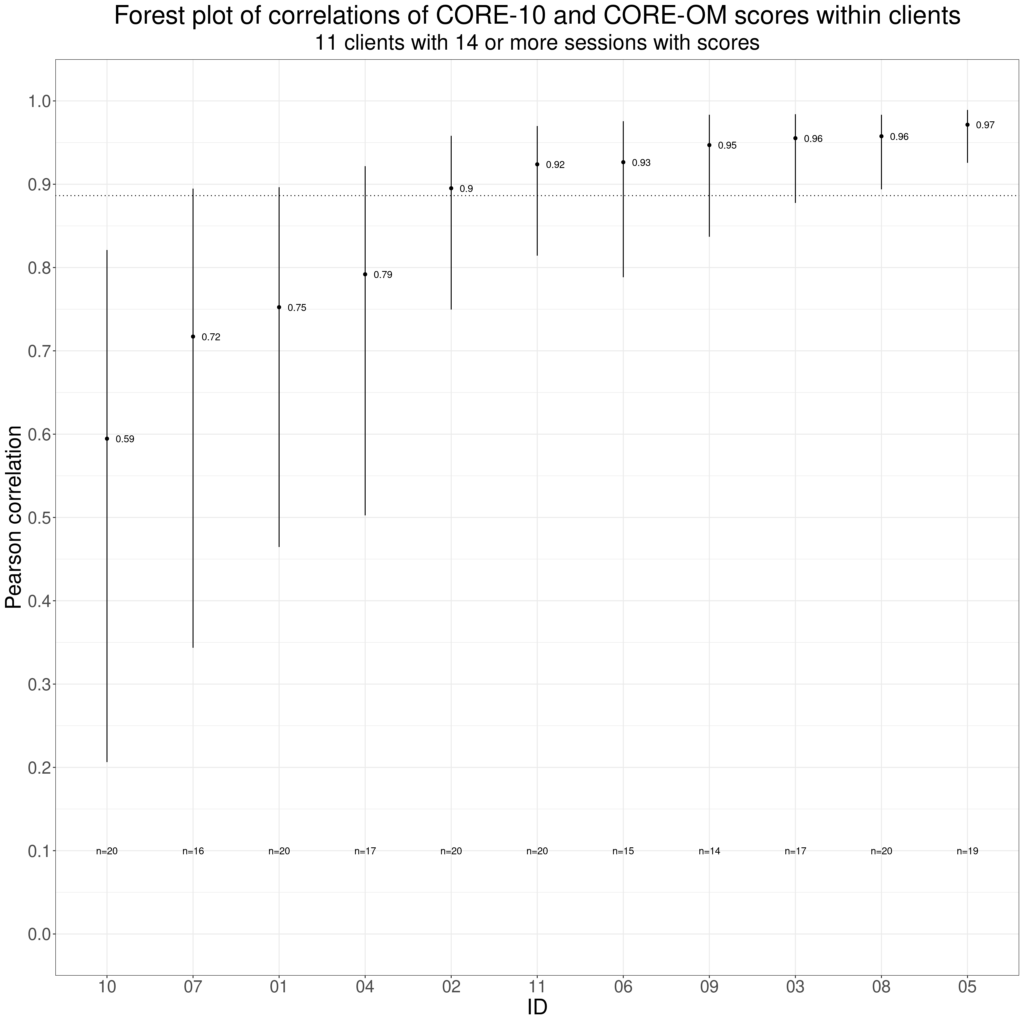
A final plea: let’s remember that correlations across different people may not be the same as correlations across repeated completions of measures within individuals. Two measures may correlate well across individuals but if a client in therapy completes both measures every session within a therapy but one measure focuses a bit more on issues that concern that individual than the other and if those are the issues that improve across that therapy then the correlation between the two measures across the repeated completions may be quite low, for another client there may be no particular difference in the pertinence of the items on the measures and the correlation of their scores across the therapy may be high, similar to or even higher than the across client “convergent validity” correlation for the two measures. These facts don’t mean that looking at across individual convergent validity correlations are bad ways to explore the relationships between measures, just that we should always remember that our multi-item measures are not physical science measures and that humans’ responses to measures are active not passive.
These next two plots illustrate this, full explanation in the Rblog post again.
Try also #
Correlation
Divergent/discrimant validity
Predictive validity
Validity
Chapters #
Mostly in Chapter 3, mentioned in Chapter 7.
Online resources #
As you will have noticed by now (!) my Rblog post: convergent validity issues (1) is pertinent and has recommendations about conducting and reporting convergent validity work. As the “(1)” suggests, that post may be followed by more there on more esoteric bits of convergent validity.
I haven’t got any specific tools to address findings in convergent validity reports now for analysing your own data but the apps relating to various aspects of correlation in my shiny apps are pertinent.
Dates #
First created 20.iv.24, tweaks 21.iv.24 and 23.iv.24.

