The only places you find this term, which means “own value” from German, is in dimension reduction analyses, particularly Principal Component Analysis (PCA) and Exploratory Factor Analysis (EFA).
Details #
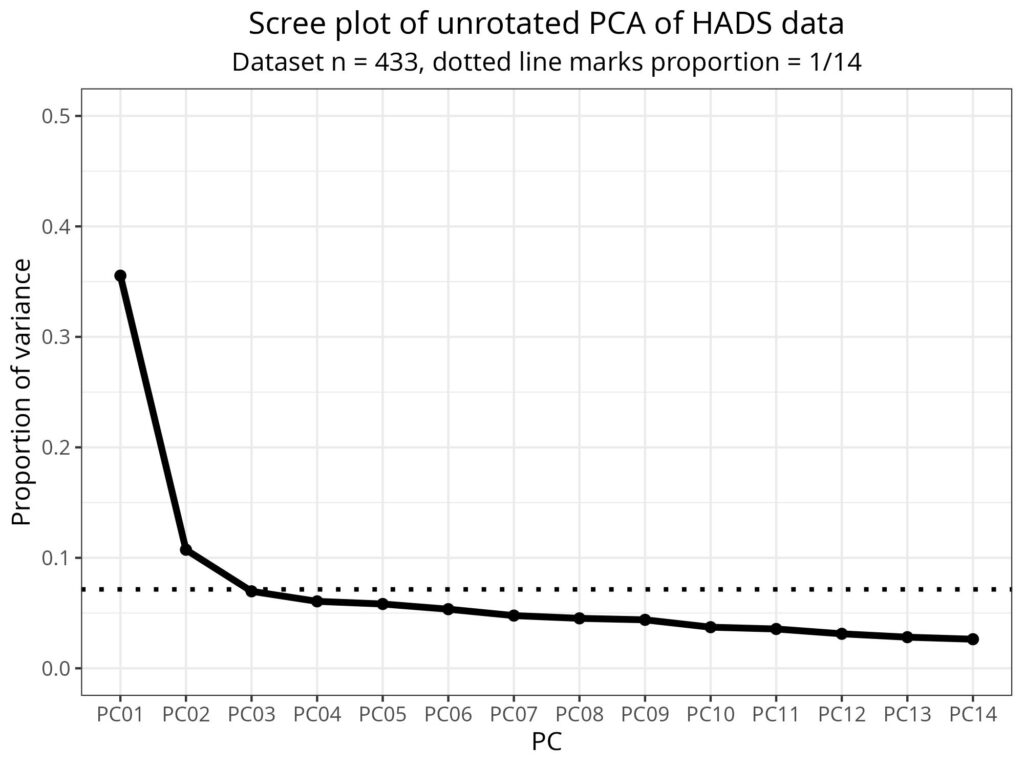
These analyses take multidimensional data and see how well all the data can be approximated in few dimensions. In my favourite example the data are 433 completions of the 14 item Hospital Anxiety Depression Scales (HADS) and the dimension reduction looks to see how well the entire 433×16 matrix of data, a 14 dimension space, can be approximated with just two dimensions: the putative anxiety and depression latent variables. Here’s the scree plot of a PCA of these data that I have used before plotting the proportion of variance against the sequential principal components.
However, it’s common to plot eigenvalues instead of the proportion of the variance. The eigenvalues scale things so that their mean value will be 1.0 regardless of the number of dimensions. Here’s the same data, same analysis, plotted with eigenvalues on the left hand y-axis and the proportion of the variance on the right hand y-axis.

Here the dotted line marks 1.0 on the left hand y-axis, the eigenvalues and still marks 1/14 on the right hand, proportion of variance, y-axis. The neat thing about the eigenvalue is that 1.0 always marks the average proportion of variance explained across the total number of dimensions whether that is 14 for the HADS, 34 for the CORE-OM, or a much higher number when dimension reduction methods are applied to very high dimension data like that from genomics or brain scans.
This leads to the “eigenvalues greater than 1” rule to decide how many dimensions you need to retain in your dimension reduction. (Also known as “Kaiser’s rule”.) However, it’s not a great rule for our typical data, see the scree plot. (And, when I get round to it, other rules you can use!)
Try also #
- Eigenvalues greater than 1 (Kaiser’s rule)
- Exploratory Factor Analysis (EFA)
- Hospital Anxiety Depression Scales (HADS)
- Principal Component Analysis (PCA)
- Scree plot
Chapters #
Not covered in the OMbook.
Online resources #
None currently nor likely from me nor obvious things on the web.
Dates #
First created 31.iii.26.

