
Created 24.i.22
I did a peer review of a paper recently and met an old chestnut: that the inter-rater agreement reported was good because the simple agreement rates were “good”. This is nonsense and that has been written about for probably a century and alternative ways summarising agreement rates have been around for a long time. Jacob Cohen invented his “chance corrected” “coefficient of agreement for nominal scales”, kappa in 1960 (Cohen, 1960). That made me think it might be useful to have a blog post here, perhaps actually several, linking with demonstrations of the issues in my “R SAFAQ” (Self-Answered Frequently (self) Asked Questions” (a.k.a. Rblog).
Background
The issue is very simple: if the thing that is rated is not around 50:50 in the ratings, then agreement even by chance is going to be high. Let’s say two raters are asked to rate a series of photos of facial expressions for the presence of “quizzically raised eyebrows” and the rate of photos that look even remotely quizzical they are given is only 10% and let’s suppose they are told that the rate is about 10% and use that information.
Now if they have absolutely no agreement, i.e. only chance agreement about what constitutes a “quizzically raised eyebrow” they may well still each rate about 90%. In that case by chance alone rater B will rate as quizzical 10% of the photos that rater A rated as quizzical: rate of agreement 10% * 10% = one in a hundred, 1% agreement. However, rater B will rate as not quizzical 90% of the 90% of photos that rater A rated as not quizzical: rate of agreement 90% * 90% = 81%. So their raw agreement rate is 82% which sounds pretty good until we realise that it arose by pure chance. Here’s an aesthetically horrible table of that for n = 100 and the perfect chance level of agreement. (In real life, sampling vagaries mean it wouldn’t be quite as neat as this but it wouldn’t be far off this.)
| n | Rated quizzical by rater B | Rated NOT quizzical by rater B | Row totals |
|---|---|---|---|
| Rated quizzical by rater A | 1 | 9 | 10 |
| Rated NOT quizzical by rater A | 9 | 81 | 90 |
| Column totals: | 10 | 90 | 100 |
That’s why Cohen invented his kappa as a “chance corrected” coefficient of agreement. It actually covers ratings with any number of categories, not just binary “quizzical/not-quizzical” and there are arguments that it’s an imperfect way to handle things but it is easy to compute (look it up, the wikipedia entry, as so often for stats, takes some beating). Pretty much any statistics package or system will compute it for you and there are online calculators that will do it too (https://idostatistics.com/cohen-kappa-free-calculator/#calcolobox, https://www.statology.org/cohens-kappa-calculator/ and https://labplantvirol.com/kappa/online/calculator.html were the first three that gurgle found for me, the last has some advantages over the first two.)
The arguments against it are sound by fairly fine print and it’s orders of magnitude better than raw agreement. Kappa for the chance agreement in that table is zero, as it should be.
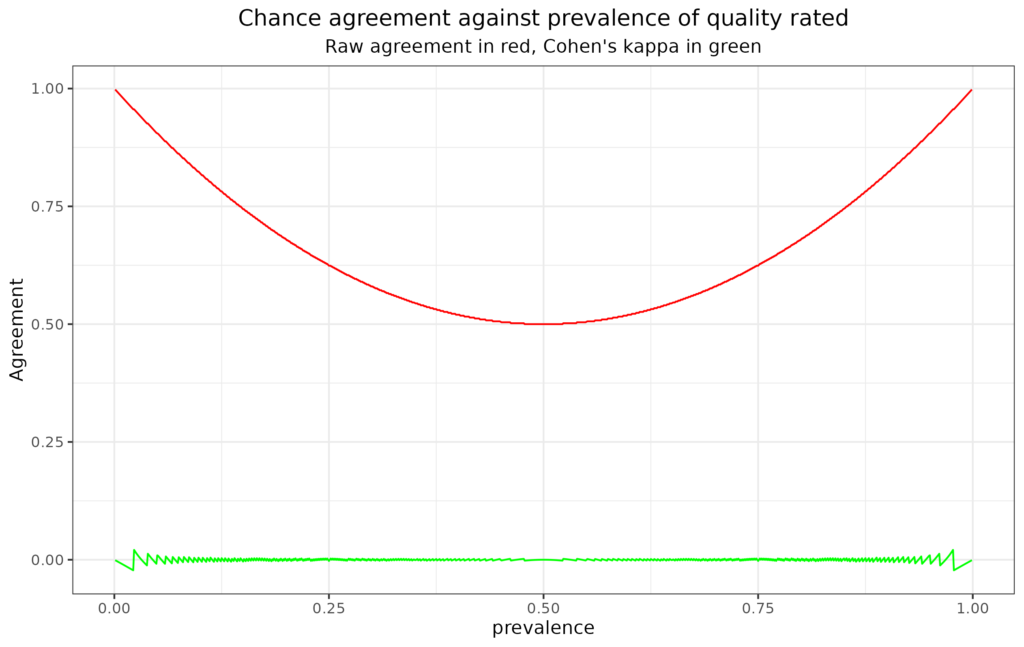
See it for different rates of the rated quality from R
This plot illustrates the issue pretty clearly. The x axis has the prevalence of the quality rated (assuming both raters agree that). The red line shows that raw agreement does drop to .5, i.e. random, 50/50 agreement, where the prevalence is 50% but that it rises to near 1, i.e. to near perfect agreement, as prevalence tends to zero or 100%. By contrast, and as a sensible agreement index should, kappa remains on or near zero across all prevalence rates.
See my “Rblog” or “R SAFAQ entry about this for more detail and plots.
References
Cohen, J. (1960). A coefficient of agreement for nominal scales. Educational and Psychological Measurement, 20, 37–46.