Quantiles are values that split the observed distribution of scores on a variable at the points that divide the distribution to get the required proportion above and below that point. The most widely used is the median which splits the distribution into two equal sized ranges. The next most commonly used quantile is the quartiles which split a distribution into four equal sized ranges: 25% below the the first or lower quartile, 25% between that and the median (2nd quartile), 25% between the median and the third/upper quartile and the remaining 25% above that and up to and including the observed maximum score.
Details #
For most observed distributions it won’t be possible to get exactly the proportions desired, for example a set of data: 1, 1, 1, 2, 3, 3, 3, 3, 4, 4, 5 doesn’t split neatly into quartiles with 25% of those 11 observations in each quartile. (Clearly you can’t split 11 observations into four equal sized groups! If you were lucky you might get a perfect split with a sample size of 12 or 16 or any multiple of 4 but you would probably still be lucky if things split so nicely.) There are actually multiple definitions of how to define quantiles but the details are incredibly unlikely to ever matter with therapy data. For what it’s worth, the default definition in CE’s beloved R statistical system has the quartiles for that set of 11 scores at 1.5, 3.0, 3.5 and 5.0, so the split is:
1, 1, 1
2
3, 3, 3, 3 and
4, 4, 5
Hardly a neat 25%:25%:25%:25% split. This also illustrates another potentially confusing thing: that the quantiles may be, almost always are for item scores, scores that are actually impossible.
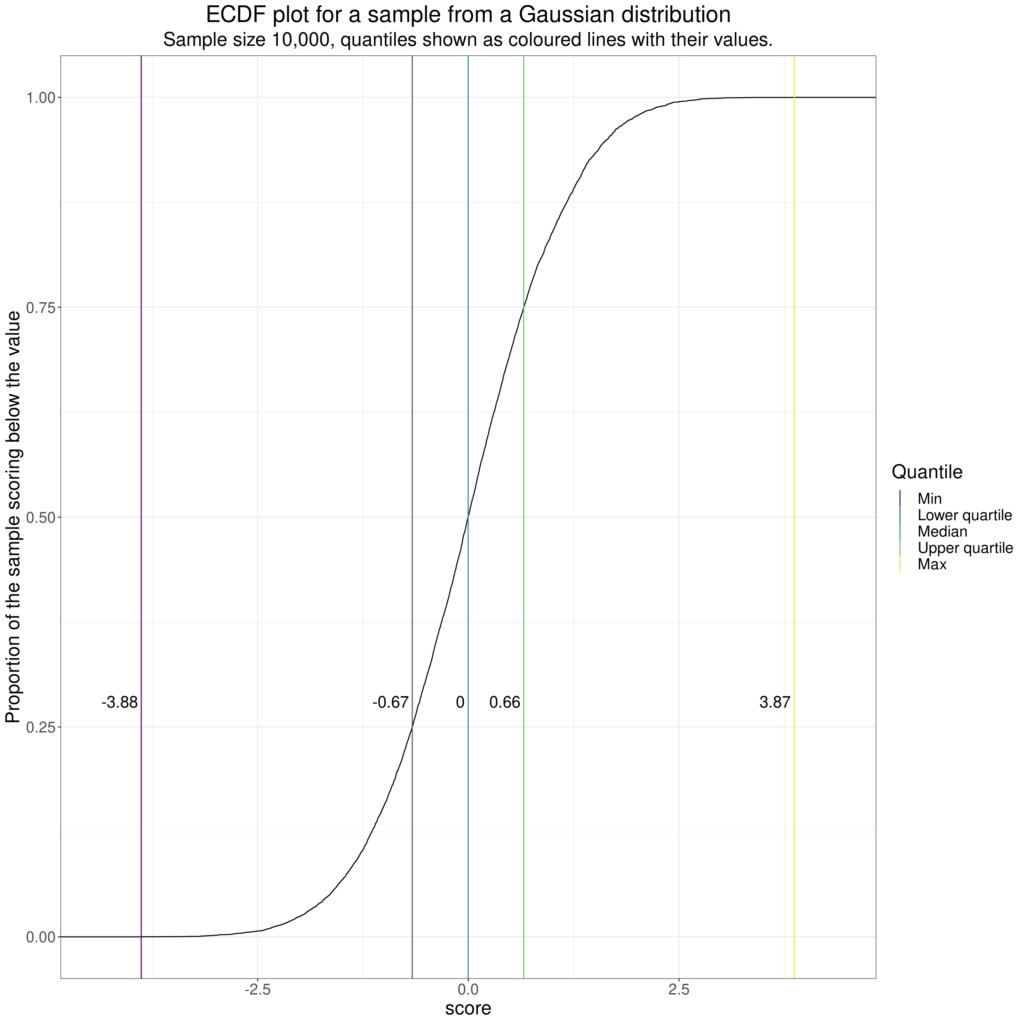
This shows an ECDF (Empirical Cumulative Distribution Function) plot of a sample of size 10,000 taken from a Gaussian (“Normal”) distribution with the 25th, 50th and 75th percentiles marked on (at -.67, 0.0 and .66). These are the same as the .25, .5 and .75 quantiles, or, to give them yet more names, the lower quartile, median and upper quartile.
Chapters #
Chapter 5
Try also … #
Quartiles
Median
Inter-quartile range (IQR)
Boxplots
Other resources for more detail (not all ready yet) #
Rblog post about the ECDF (with lots on quantiles)
Rblog post about confidence intervals around quantiles
Rblog post about mapping individual scores to where they come in large sample distributions of scores

