Back in 2002, with two colleagues, I published a paper:
Evans, C., Hughes, J., & Houston, J. (2002). Significance testing the validity of ideographic methods: A little derangement goes a long way. British Journal of Mathematical and Statistical Psychology, 55(2), 385–390. https://doi.org/10.1348/000711002760554525.
Contact me if you’d like a copy!
In the paper we used a bit of old maths to show a simple way of validating idiographic/ideographic data. The data in question were principal component plots of person repertory grids created by six patients in a prison psychotherapy group (who gave permission for this). These plots are completely personal to each individual. They depend on the elements the patients chose for the roles in the grid (e.g. victim, brother, boss, ideal self) and the constructs on which they chose to rate them, (e.g. aggressive, caring, selfish) and the ratings they gave each element.
Those principal component plots represent the best two dimensional plot of all the ratings for each grid. Julia (Houston) had asked the two therapists if they could map the six plots back to the patients. As we said in the paper:
Both therapists matched four of the six pre-therapy grids successfully; one therapist matched all six post-therapy grids and the other matched three of the six. We sought to assess the probabilities that these matchings might have been achieved by chance alone. This paper reports the logic which shows that this probability was lower than a conventional criterion of significance ( p < 0.05) where four or six grids were matched correctly.
This is a completely general method, the steps are:
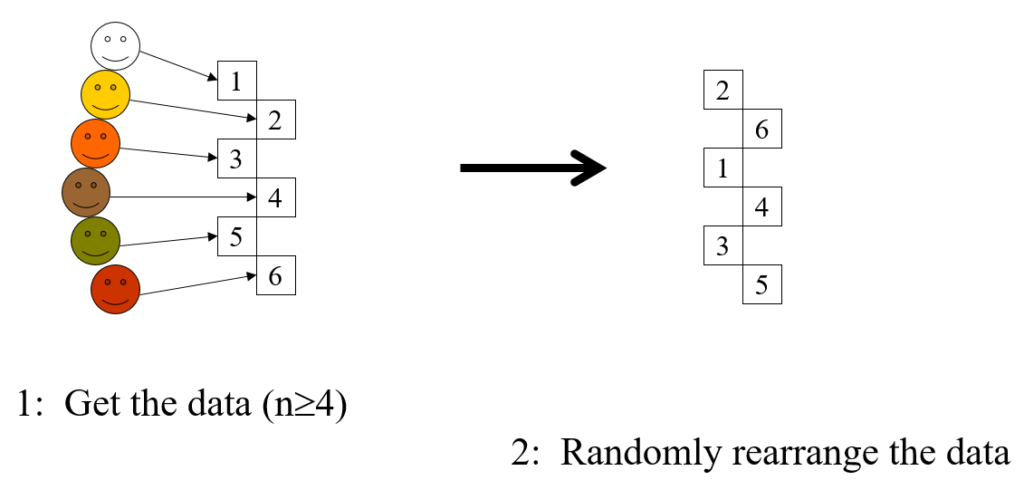
- Take the data, the idiographic information you have from n individuals (n >= 4)
- Shuffle the data
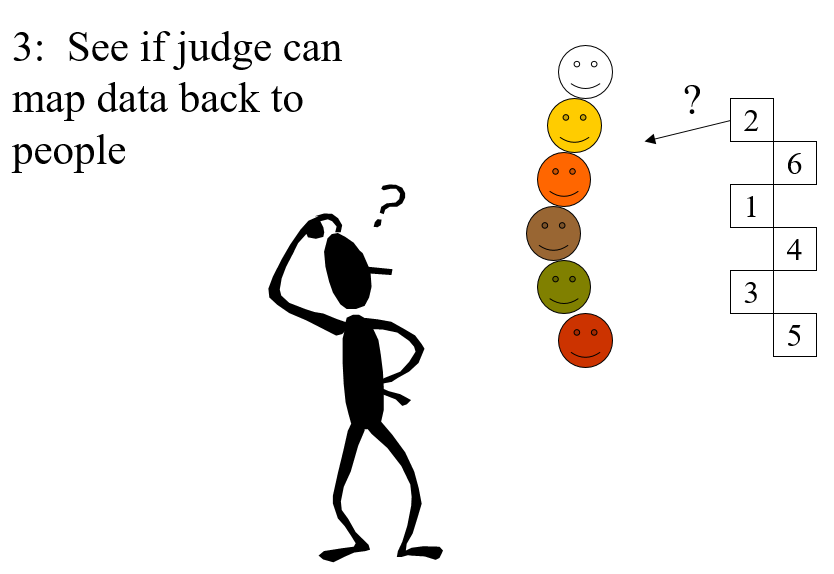
- Present them to someone who knows the people who created the data
- Ask judge to match data to people
- The score is the number of correct matches
- If the score is 4 or more, regardless of n, the chances of this being achieved by chance matching alone is p < .05, i.e. statistically significant at the usual criterion for that.
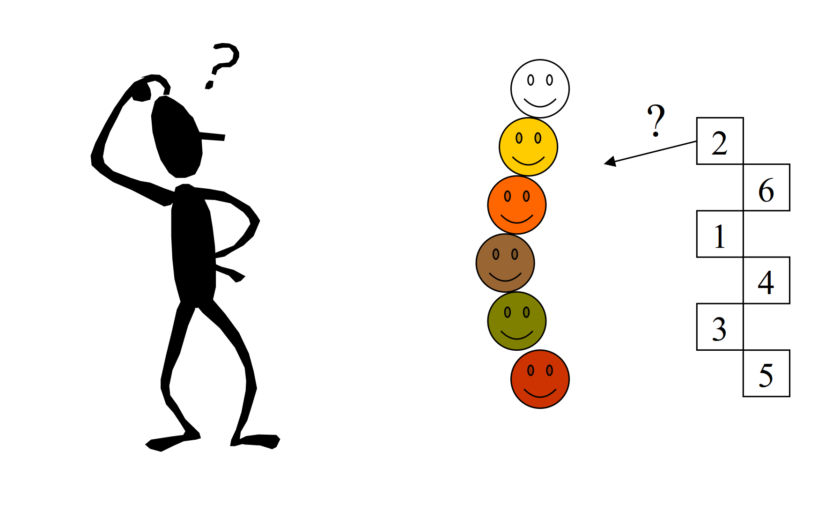
Here’s the same in slightly tongue in cheek cartoon format.
Steps 1 and 2
Step 3
Steps 4 and 5
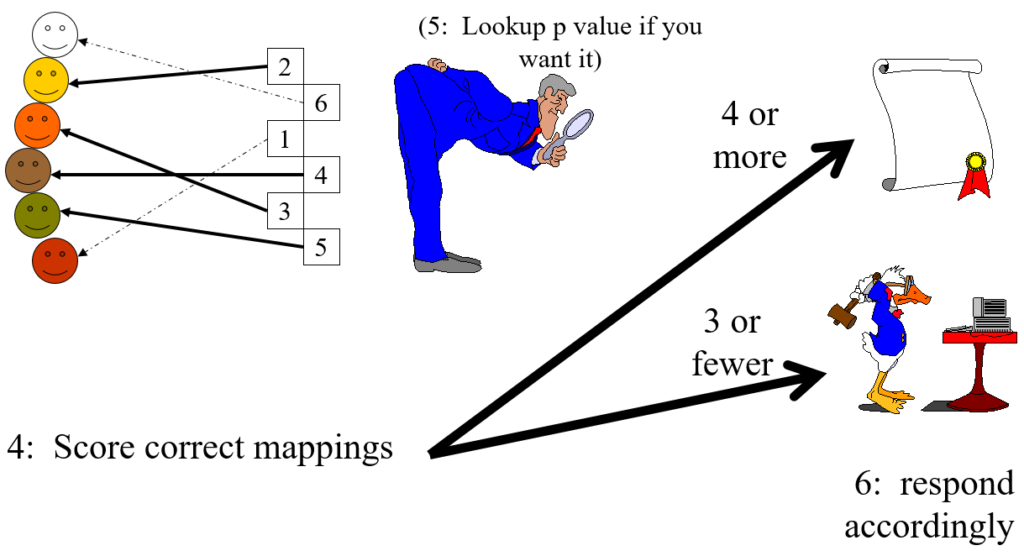
In the cartoon example the only thing that distinguishes the six sets of idiographic data is actually their colour (yes, this is not a very serious example). The judge successfully mapped four of the six which has probability (that they would score four or even better by chance alone) of p = .022 (see lookup table at https://www.psyctc.org/psyctc/root/stats/derangements-lookup-table/).
That is clearly less than .05 so it meets the conventional criterion of “statistical significance”, i.e. by that convention we reject the null hypothesis that no information is contained in the data and accept the alternative that, though the data were idiographic, and the way the judge did the mapping may have been unique to that one judge and their particular knowledge of the six people (i.e. an idiographic judgement on idiographic data), it has some validity.
To most of us who are neither mathematicians nor statisticians it may seem utterly counter-intuitive that regardless of the number of objects a score of four or more is always good enough for p < .05. Perhaps it’s so counter-intuitive perhaps that we switch off our own judgement and either decide that the method was published in a good peer-reviewed journal and so must be correct (it is!), or simply believe it cannot be correct.
However, it’s not as counter-intuitive as it may first seem: as the n goes up the number of ways of mapping just four of them correctly does go up rapidly as this table shows.
Number of ways of getting four correct from n objects
| wdt_ID | n | Number of ways of getting four correct from n |
|---|---|---|
| 1 | 4 | 1 |
| 2 | 5 | 0 |
| 3 | 6 | 15 |
| 4 | 7 | 70 |
| 5 | 8 | 630 |
| 6 | 9 | 5,544 |
| 7 | 10 | 55,650 |
| 8 | 11 | 611,820 |
| 9 | 12 | 7,342,335 |
| 10 | 13 | 95,449,640 |
However, the total number of ways of permuting the n is also rocketing up and faster:
Total number of ways of permuting n objects
| wdt_ID | n | PossibleWays |
|---|---|---|
| 1 | 1 | 1 |
| 2 | 2 | 2 |
| 3 | 3 | 6 |
| 4 | 4 | 24 |
| 5 | 5 | 120 |
| 6 | 6 | 720 |
| 7 | 7 | 5040 |
| 8 | 8 | 40320 |
| 9 | 9 | 362880 |
| 10 | 10 | 3628800 |
| 11 | 11 | 39916800 |
| 12 | 12 | 479001600 |
| 13 | 13 | 2147483647 |
| 14 | 14 | 2147483647 |
The two accelerations pretty much cancel out and so keep the probability of getting four or more correct by chance alone below .05 for any n as shown below.
Significance of scoring four or more
| wdt_ID | n | Total possible permutations | score | Number of ways of getting four correct | p (for four or more correct) |
|---|---|---|---|---|---|
| 1 | 4 | 24 | 4 | 1 | 0.04 |
| 2 | 5 | 120 | 4 | 0 | 0.01 |
| 3 | 6 | 720 | 4 | 15 | 0.02 |
| 4 | 7 | 5,040 | 4 | 70 | 0.02 |
| 5 | 8 | 40,320 | 4 | 630 | 0.02 |
| 6 | 9 | 362,880 | 4 | 5,544 | 0.02 |
| 7 | 10 | 3,628,800 | 4 | 55,650 | 0.02 |
| 8 | 11 | 39,916,800 | 4 | 611,820 | 0.02 |
| 9 | 12 | 479,001,600 | 4 | 7,342,335 | 0.02 |
| 10 | 13 | 2,147,483,647 | 4 | 95,449,640 | 0.02 |
| 11 | 14 | 2,147,483,647 | 4 | 1,336,295,961 | 0.02 |
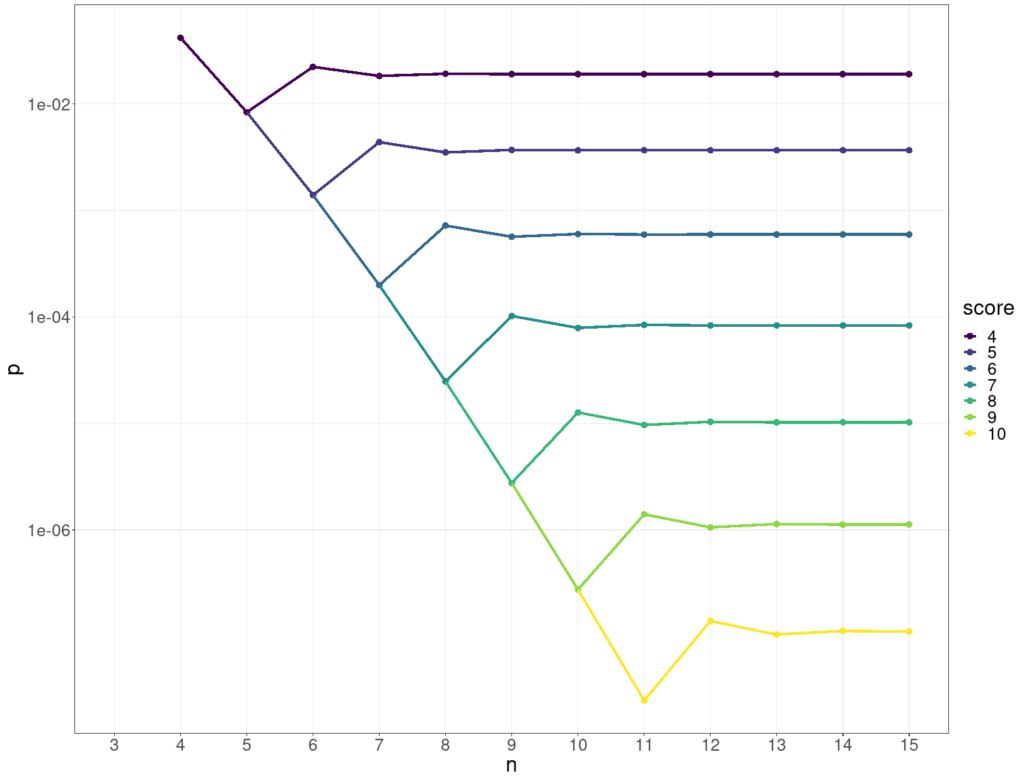
This shows how the p value for various scores (on the y axis) stabilises as the number of objects, n, goes up (x axis).
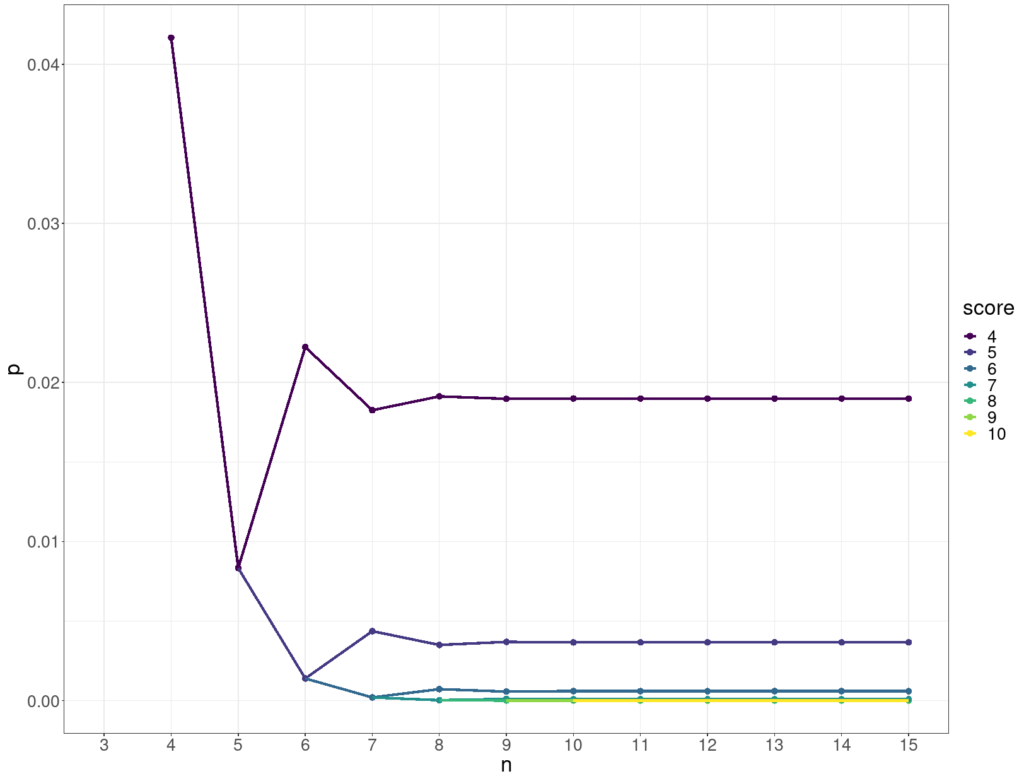
Here’s the same data but with the p values on a log10 scale on the y axis.