Falling out of much use across the 21st Century but you may still see it. It’s one way of looking at “dimension reduction”, i.e. at approximating multidimensional data in relatively few dimensions. Here’s an example.
Scree plots used to be very common in exploratory factor analysis (EFA) and principal component analyses (PCA) of multi-item questionnaire data in our field though you could occasionally see them in discriminant function analysis. They have faded rather as confirmatory factor analysis has increasingly replaced EFA and PCA, sometimes very rightly, sometimes much less so.
Details #
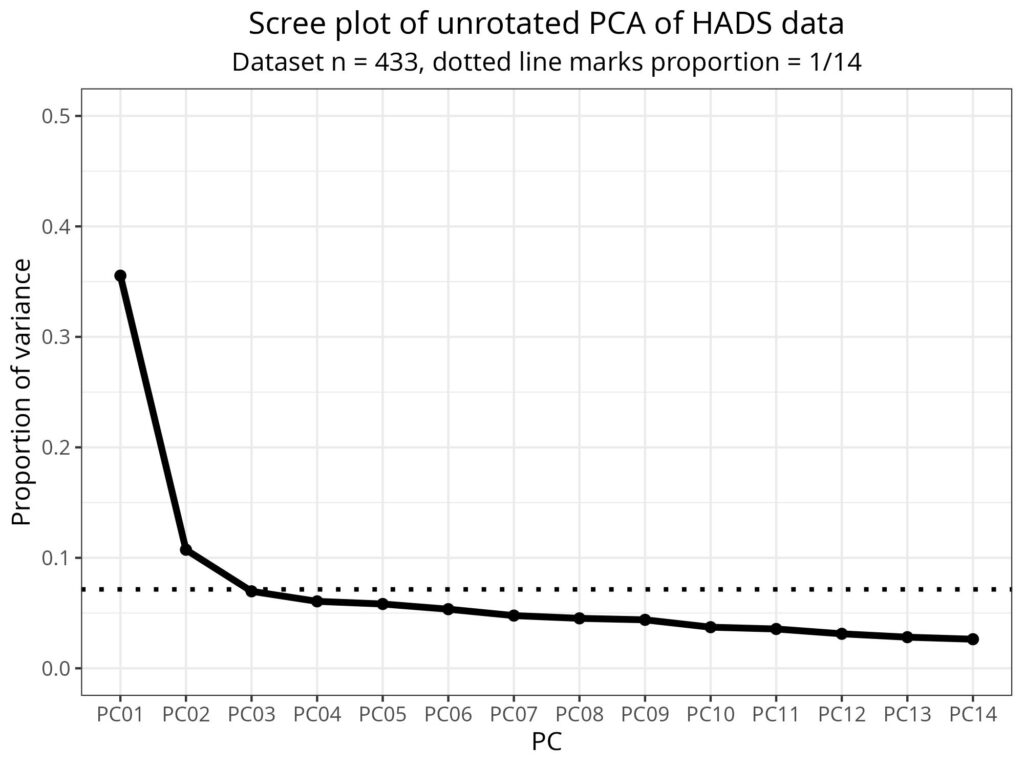
So what is a scree plot? As in the example above, it plots the proportion (or percentage) variance or the eigenvalue on the y-axis against the principal components (PCA), factors (EFA) or discriminant function (discriminant analysis). All these methods (almost always) give us decreasing (“monotonic descending”) values of that y value as the x values increase.
So what? Well a key question in dimension reduction, in all these methods, is how parsimonious a representation of the original data is best, sufficient, good enough. The scree plot is one way to answer this question and it was associated particularly with the work of Raymond Cattell (see Wikipedia here for a good introduction to this rather unusual and important psychologist and Cattell, R. B. (1966). The scree test for the number of factors. Multivariate Behavioral Research, 1, 245–276 for his paper introducing the scree test). Cattell argued, and the argument has held up fairly well, that looking for an “elbow” in the scree plot between the “cliff” or “black run” (my terms!) at the left and the “scree” on the right is the best place to stop considering more dimensions. This is generally better than the other common rule “eigenvalues greater than 1”. The latter was the default in SPSS for EFA and PCA long after much simulation evidence showed that it was a poor rule. In the scree plot above the two rules agree that two dimensions are a sensible choice as the third eigenvalue is just under 1 as shown by its proportion of the variance per component has dropped just below 1/14. (See eigenvalue and PVE: proportion of variance explained if this is gobbledygook!)
Try also #
- Discriminant function analysis
- Exploratory Factor Analysis (EFA)
- Principal Component Analysis (PCA)
- Proportion of Variance Explained (PVE)
- Psychometrics
Chapters #
Not covered in the OMbook.
Online resources #
None likely from me I think nor obvious online.
[Auto]biographical note #
Back probably in 1990 or 1991 I got asked by John Birtchnell to write a commentary on a late paper by Cattell (Cattell, R. B. (1992). Human motivation objectively, experimentally analysed. British Journal of Medical Psychology, 65, 237–243.) The comment came out as Evans, C. (1992). Could ‘objective, experimental’ analysis of human motivation really improve psychotherapy? British Journal of Medical Psychology, 65(3), 245–254. https://doi.org/10.1111/j.2044-8341.1992.tb01704.x but when John wrote to Cattell asking him to clarify something he had quoted from I think one of his own papers, Cattell apparently replied saying that termites had recently eaten much of his library! I think research publication may or not have improved quality since then but it was certainly more fun then.
Dates #
First created 30.iii.26.

