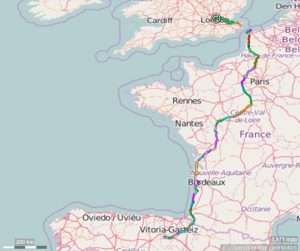
A lot of work with the excellent (and free) GPS tracker and Greenshot programs last night got me lots of maps. Won’t have time to put them all up in the maps section now so here are summaries and highlights.
First the summary: the trip so far. The colours just mark separate recordings from my Garmin. I have yet to work out how to colour the days.
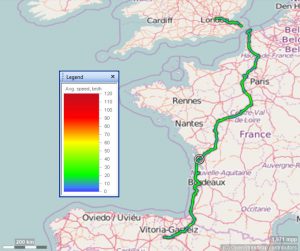
Average speed doesn’t vary much at this scale:
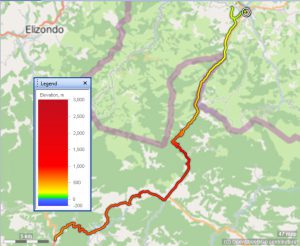
Altitude does a bit:
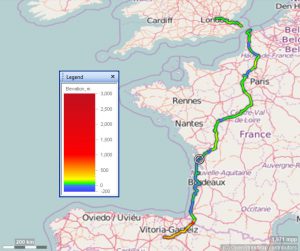
You can see the long stretch within a few tens of metres of sea level down the French Atlantic coast, the climb over the (lowest bits of) the Pyreenees and the relatively sustained altitude since (hardly going to cause oxygen deprivation though!)
And here is heart rate:
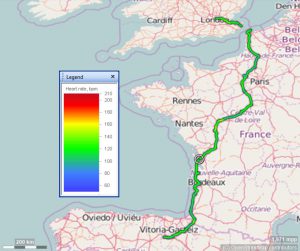
Which doesn’t show anything at this scale.
Here’s the mountain bit showing the altitude change:
And the gradient:
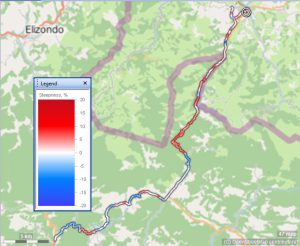
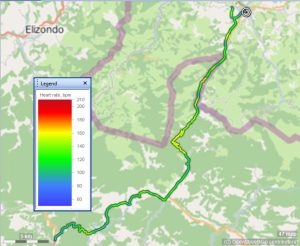
Those blue descents were heaven but those climbs were … well, pretty much the opposite. Here’s the heart rate. Remember that the speed ranged between as low as 6kph on tough parts of the climb where the gradient went into double figures but, if I remember rightly, saw a wonderful 72kph for a short time on one the straighter bits of descent. That means that the same distance on the map may have taken 11 times longer where I was barely moving compare to where I was flying I’m impressed that I could sustain a heart rate up in the 140-160 range for as long as it turned out I could. Can’t really see that on this plot.
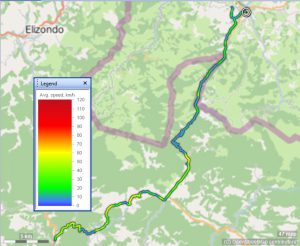
So finally, here’s that day in speed:
Fun!
Fun!