This is the very basic reality that if you have unreliable measures of things, and we always do, then the relationships between data using those measures will underestimate the relationships between the variables we would see if we had perfectly reliable measurements. I.e. the observed relationships are attenuated by the unreliability. It’s usually discussed in terms of attenuation of correlations but it’s true for any statistical relationship: correlations certainly but also estimation of a difference in means.
Details #
The basic issue is very simple: if a non-zero correlation (or other non-null relationship) exists between two variables that are perfectly measured the relationship between the variables is reduced from that relationship when, as always in our world, the variables are actually measured with random error: noise in the measurements. This is shown in this set of plots which starts with a sample of *n* = 5,000 between two Gaussian distributed variables whose population correlation is .9.
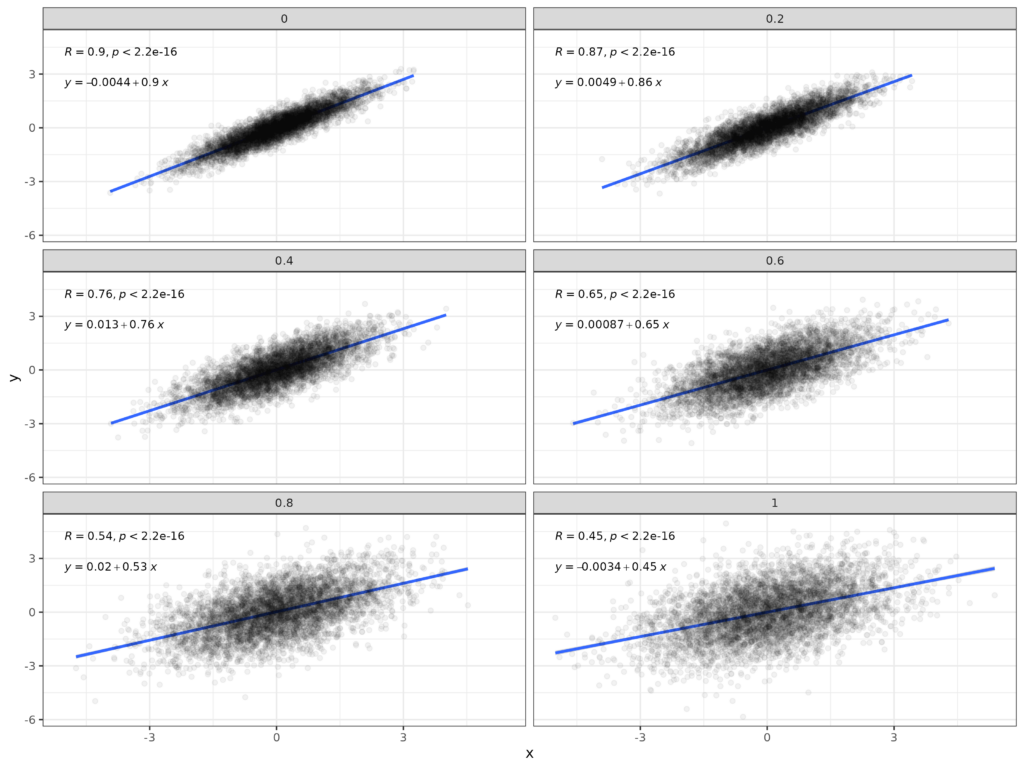
The plot in the top left facet has the data measured with no error and then the subsequent plots show the data after adding random noise to both variables. The SD of the noise is shown in the headers of the facets and goes up from zero to 1.0. The SD of the population variables is 1.0 so adding the noise is reducing the reliability of the measured variables. This table shows observed correlations and the values after correction for the unreliability of measurement.
The correction for unreliability is:
$$correctedCorr = \frac{observedCorr}{\sqrt{rel_{x}rel_{y}}}$$
As the reliabilities of both the variables were the same that boils down to just this here.
$$correctedCorr = \frac{observedCorr}{reliability}$$
Try also #
Chapters #
Not covered in the OMbook.
Online resources #
One of my Shiny apps will give you the attenuated correlations for any unattenuated correlations and reliabilities of the two variables: here. A more complicated app, here, will handle a number of reliabilities for one of the variables and will give you a downloadable plot of the attenuated correlations for a range of unattenuated correlations … and will give you a downloadable table of the values. Powerful but probably mainly of explanatory/pedagogical value. A third app, here, gives you the ‘corrected’ correlation given an observed correlation and the two reliabilities.
Dates #
First created 27.iv.24, link to shiny app added 9.x.24, simpler app link added 10.x.24, getCorrectedR link added 13.x.24.

