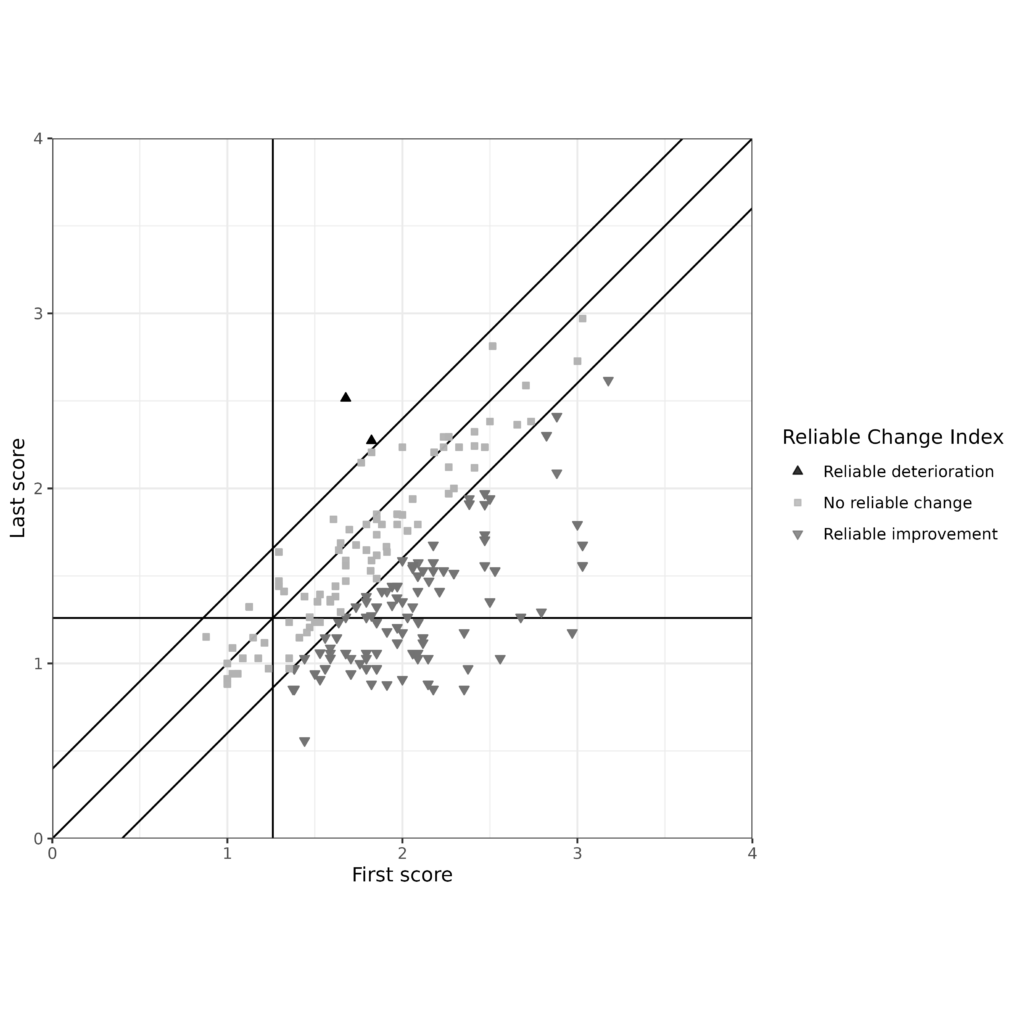
The Jacobson plot has become a staple plot when reporting change data. I looks like this:
Details #
Try also …
#Clinically Significant Change (CSC)
Reliable and Clinically Significant Change (RCSC) method (PSYCTC.org page)
Reliable change and the RCI (Reliable Change Index)
Jacobson & Truax methods (just a link to the same PSYCTC.org page)
Chapters #
Chapter 5. Analysing change data from outcome measures
Online support #
I hope it won’t take me too long to take the code that created the Rblog above into R functions and then to put them into an interactive shiny app that will allow you to put your own data into the app and choose the plots and tabulations you want from them.
Created 12th June 2023.

