An important distinction that is essentially mathematical. As the name suggests this is about lines but the crucial thing about a linear relationship is that it can be described in terms of a straight line, no-linear relationships are not (immediately) able to be related to straight lines.
Why on earth would that matter for mental health, therapies and change measurement? Because, very loosely, linear relationships are “well behaved”, predictable, “tractable” for mathematicians and statisticians to handle where non-linear relationships are often not and sometimes “chaotic”. Also because human behaviours, feelings and thinking is a mix of linear and non-linear, or, more precisely, can be represented as a mix of linear and non-linear processes and because non-linear processes can be decisive, switch like, leading to state changes where linear processes do not have those features.
Details #
Here is a classic linear relationship.
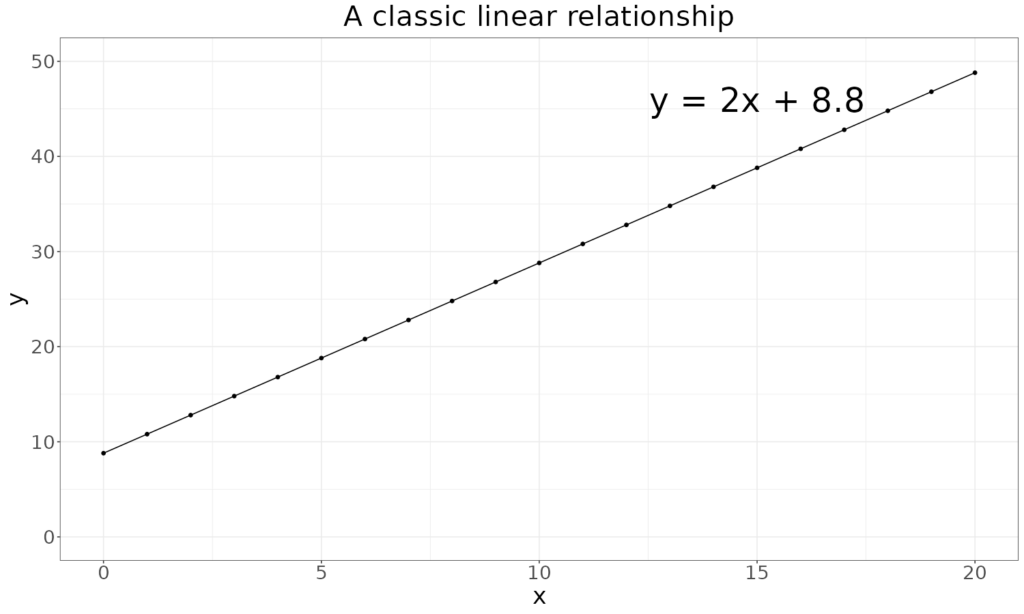
As x increases, perhaps it’s a count of sessions, y, perhaps a measure of “well-being” increases and the relationship is purely linear. Here’s a slightly more realistic plot where the change is a mix of a linear relationship and added random “noise”.
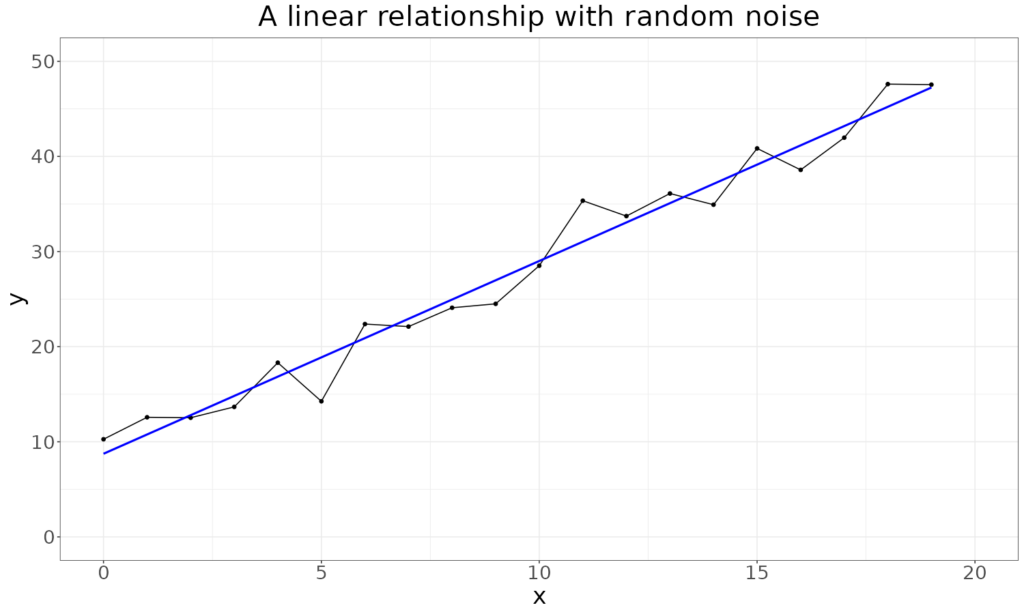
The blue line is the linear fit to those y points and it’s easy to see that it’s a pretty well linear relationship. So what about a non-linear relationship? Here is one:
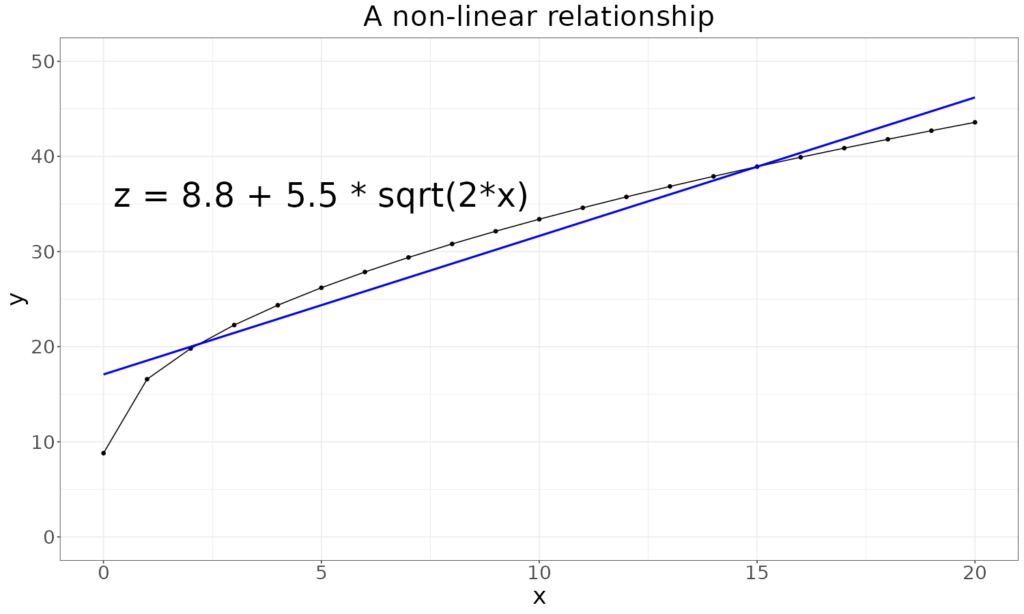
That shows a curve that starts at the same score (8.8) at session 0 (assessment?) as in the linear relationship but which then shows a curvilinear relationship with x. As it happens I chose this 5.5 times the square root of 2 times x to show a curve fitting the same y range as in the linear example but the misfit between the actual curve and the best fitting linear relationship (in blue) is very clear.
Adding some noise to make the model a bit more realistic makes it a bit harder to see that the curve is not linear:
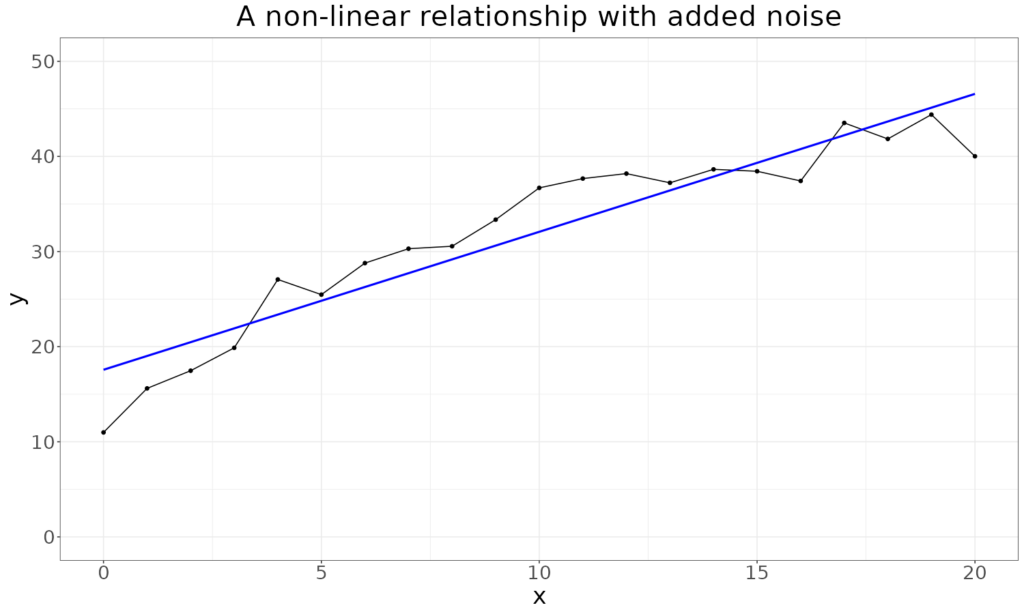
However, it can still be seen that the first points are below the best fitting linear relationship line, then the middle points are consistently above that line and the last points are dropping below it.
All linear relationships have an equation of the form:
\(y=mx + c\)
That says that the y value, here perhaps a well-being score, is made up of some multiple, m, of the x value and a constant, c. So in our linear example above c is 8.8 and m is 2. Linear functions can also be functions of more than one predictor:
$$y = mx + nz + c$$
Linear relationships underpin “linear regression”, a fundamental statistical method for the exploration of relationships that allow for the addition of noise or error as in the second plot above. By contrast with this consistent equation form of linear relationships there are many non-linear relationships, some can have equation forms and some may not easily reduce to equations. The non-linear relationship above was as square root one which is one of an infinite set of “power relationships” including the famous quadratic:
$$y=mx^{2}+c$$
or the cubic:
$$y=mx^{3} +c$$
One complication is that some relationships can be “linearised”, for example my non-linear square root relationship above becomes linear if instead of plotting raw x values on the x axis we use the square root of x, technically “transforming” the x values:
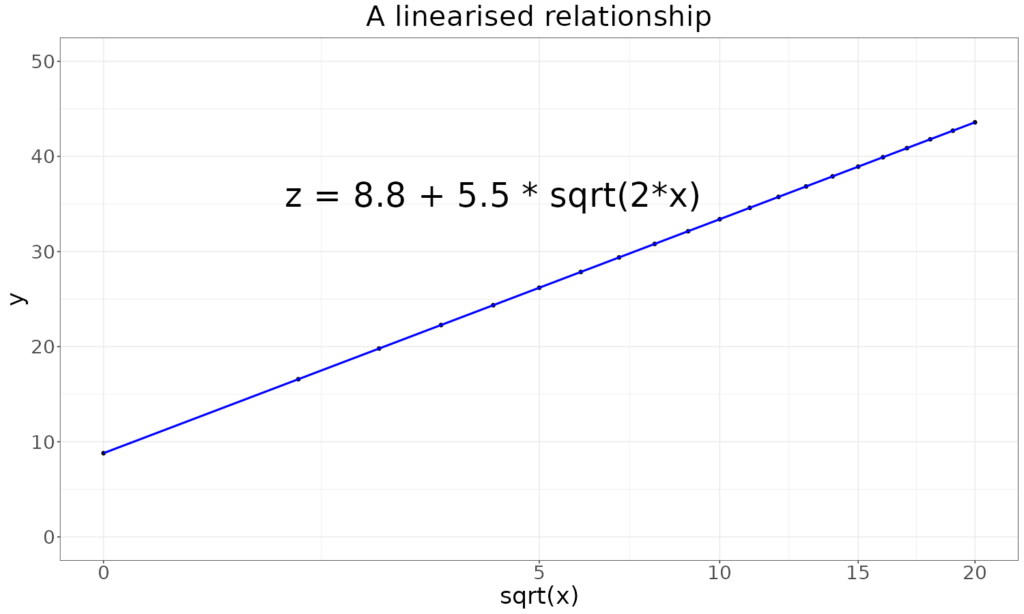
That is plotting exactly the same 21 points as in the plot titled “A non-linear relationship” but the x axis is now the square root of the actual x values (you can see that from the unequal spacing of the points on the line and the value marks on the x axis). This has “linearised” the relationship making it easy to analyse using linear regression methods. This sort of linearising is often used when plotting change against time or against numbers of sessions.
Try also #
Chaos theory
Complexity
Iterative processes
Linear regression
Modelling
Power relationships (mathematical/statistical)
Transforms/transforming data
Chapters #
Not explicitly discussed in the book though there are hints of these issues perhaps in Chapter 7 on individual practitioner change explorations.
Online resources #
None currently but search for “chaos theory” and “Mandelbrot sets” to have a bit of fun.
Dates #
First created 20.xii.23.

