In colloquial language we use average to describe a norm or a “typical” set of circumstances or numbers. ‘The average life expectancy is three score years and ten.’ However, in statistics there are a number of “averages” but for our purposes the only one we need is the arithmetic mean: the sum of all the values of the variable divided by the number of observations.
Details #
The mean is the statistic most used to summarise the “central location” of a set of data. In lay terms it’s what’s usually mean by “the average” and to pedants (guilty as charged) it’s the “arithmetic mean” as there are actually other means. It’s the number you get if you add up all the numbers in your sample and divide by the number of observations. So the mean of the set of observed scores: 1, 2 and 3 is 2 because 1 + 2 + 3 = 6 and 6 / 3 = 2. To give an even simpler example the mean of 2, 2 and 2 is 2 (2 + 2 + 2 = 6 and 6 / 3 = 2). Things aren’t always that neat, the mean of 1, 2, 2, 2, 3, 7 and 5 is 3.14 to two decimal places. (As 1 + 2 + 2 + 2 + 3 + 7 + 5 = 22 and 22 / 7 = 3.14.)
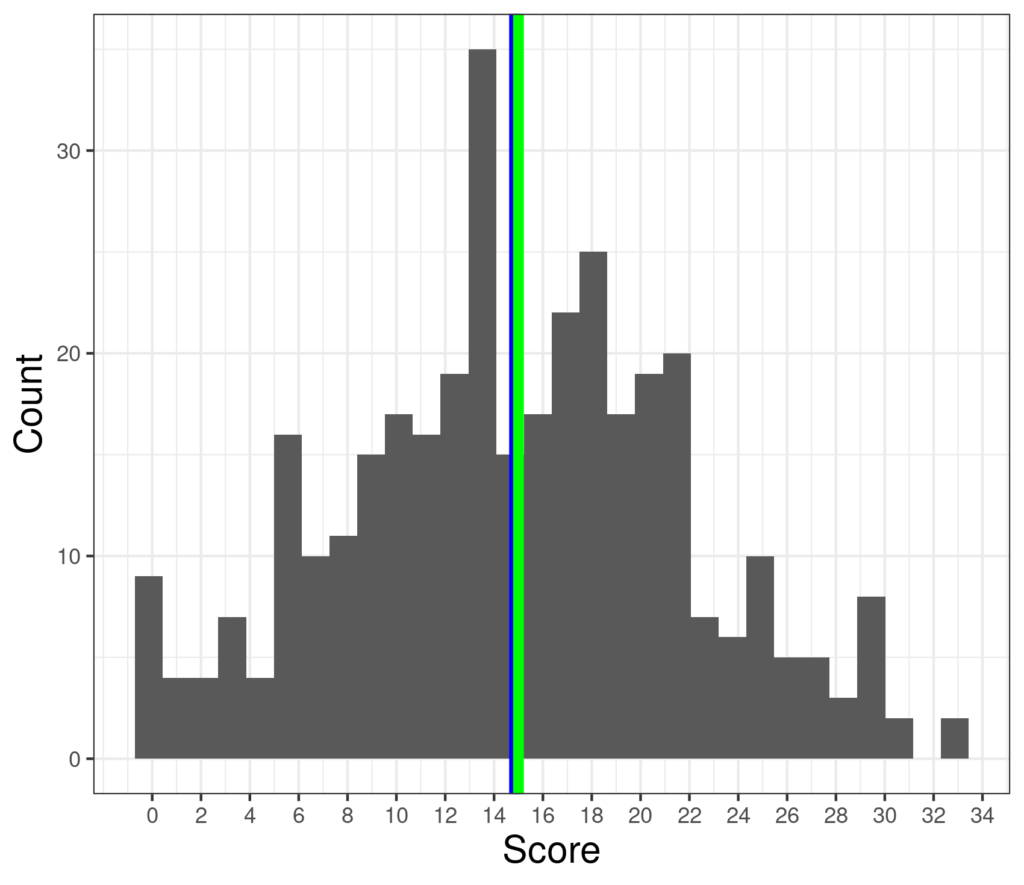
Here’s a bigger set of (simulated data) with 350 scores ranging from zero to 33, a mean of 14.8 and median of 15.
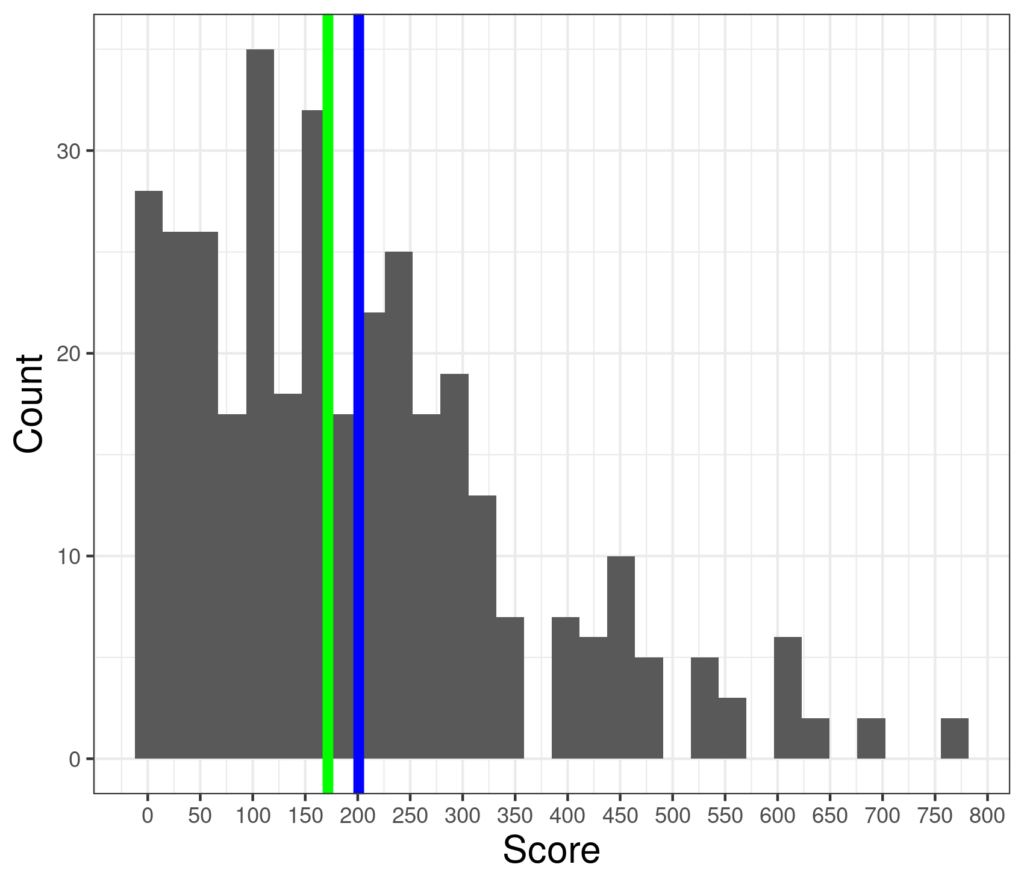
And here’s a much less symmetrical distribution of scores ranging from zero again but up to 768 (clearly scores from a different measure) and now with mean 201 and median 172.
Try also #
Median
Distribution
Skew
Summary statistics
Standard deviation (SD)
Variance: introduction
Variance: computation and bias
Chapters #
Chapter 5
Online applications #
In due course there will be a shiny app to compute the mean and other summary statistics for a set of data.
Dates #
Created 1.xi.21, links updated 14.viii.24.

