| The mode is the most frequently occurring value in a set of data. For example, in this series: 2 2 4 5 6 7 7 7 9 13 38 we can see that 7 is the most frequently occurring number or variable: the mode. |
Details #
The mode is sometimes described as another form of statistical average or measure of “central location” but that’s not necessarily true at all particularly as distributions can be “bimodal”: have more than one clearly more frequently occurring value than the others. See for instance Figure 5.8 in the book.
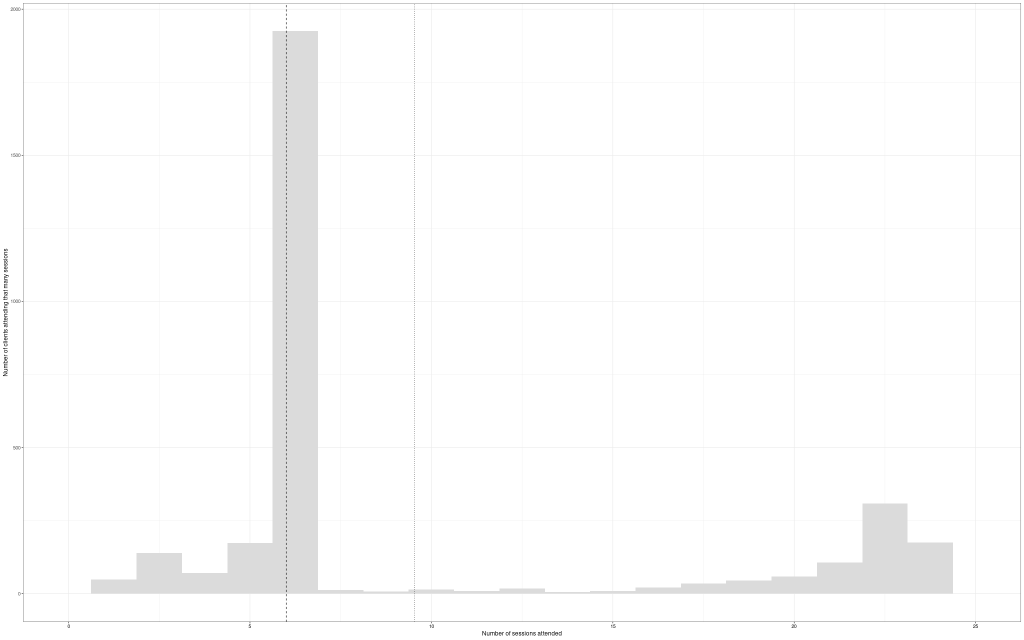
Figure 5.8: click or double click to get larger image

This histogram of the numbers of sessions has one clear mode, on six sessions, but there’s a second peak on 23 sessions and that’s a sufficiently clear peak that this would generally be called a “bimodal” distribution and clearly the two modes can’t indicate a central location (here the median is indicated by the dashed line, which is pretty much on the first mode, and the mean is indicated by the dotted line, between the two modes).
Try also … #
Central location
Mean
Median
Histogram
Chapters #
Chapters 5 and 8.

