Ranking is what it says! If you have a set of scores you can rank (well, if at least some of them are different from others, if not, you have no variance and no ranking). Why does it matter? Well, it can be a handy way to look at data and there has been a big political vogue for “league tables” which are about ranking (and have a lot of issues statistically). Traditionally, when statistical methods were divided into “parametric” and “non-parametric” ranking underpinned many non-parametric tests, notably Spearman’s correlation coefficient. That framework has been markedly diminished by the arrival of bootstrap statistical methods but ranking can still be a useful tool and is useful, and easy, to remember.
Details #
Say you have twelve scores (to one decimal place with possible scores bounded by 0 and 4). Here they are with their ranks:

We can see that the lowest score of 0.2 is ranked first, ranked 1 (because I am ranking by increasing scores. The highest score, 3.8 is ranked 12 as there are twelve scores. Here I’ve ordered the scores to show that the ranking is correct.

That is so called “perfect ranking” as no two scores are the same, we have no ties.
Say three more scores are added and now these are all three repeats of earlier scores. So now we have this:

This brings us to a bit of real small print, completely irrelevant for MH/therapy work but probably worth me including here just in case you hit reading papers or talking with statisticians (do you?!) This small print is that there are actually different ways of allocating ranks in the presence of ties. Here you go!

The only reason this would ever matter to us if we have computed ranks one way and a statistician has computed them another way. It won’t actually affect any statistical analyses of the ranks that I can imagine. Just to explain them, working left to right on list listing in which they have been ordered by score. I’d added those arbitrary ID values as being able to distinguish the rows matters for the different ranking methods.
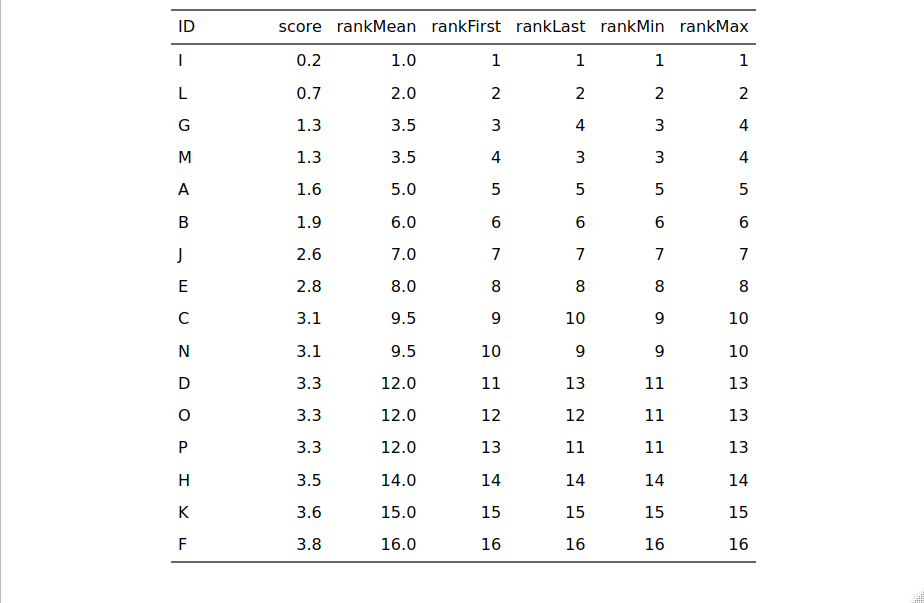
- rankMean is the mean of the possible ranks, so the score 1.3 has appeared twice coming after 0.7 which was ranked second so the two values of 1.3 get ranks of 3.5, the mean of 3 and 4. This is the commonest way of giving ranks to values.
- rankFirst: the first of of the tied values gets the lower rank and the next the next rank and so on. That’s why ID G who scored 1.3 gets rank 3 and ID M who also scored 1.3 gets rank 4: because M came after G in the original data.
- rankLast: the reverse of the last method so this way M gets rank 3 and G gets rank 4
- rankMin: here any ties get the lowest value for the ranks. So both G and M get rank 3. (Apparently this is often used in sport rankings.)
- rankMax: all tied values get the maximum value for their ranks.
Try also #
League tables
Incomplete ranking
Complete ranking
Spearman correlation coefficient
Non-parametric tests
Chapters #
Not particularly covered in the book. Sort of pertinent to Chapter 5.
Online resources #
Dates #
First created 11.viii.23, links tweaked 24.ii.25.

