[see quartiles!]
| The “interquartile range” is the distance between the 25th centile (the score such that 25% of the observed scores are smaller than this) and the 75th centile (the score such that 75% of the observed scores smaller than this). The 25th and 75th centiles are described as the lower and upper quartiles as, with the median, they separate the distribution of scores into four parts, hence quartiles and hence the “inter-quartile” range. |
Details #
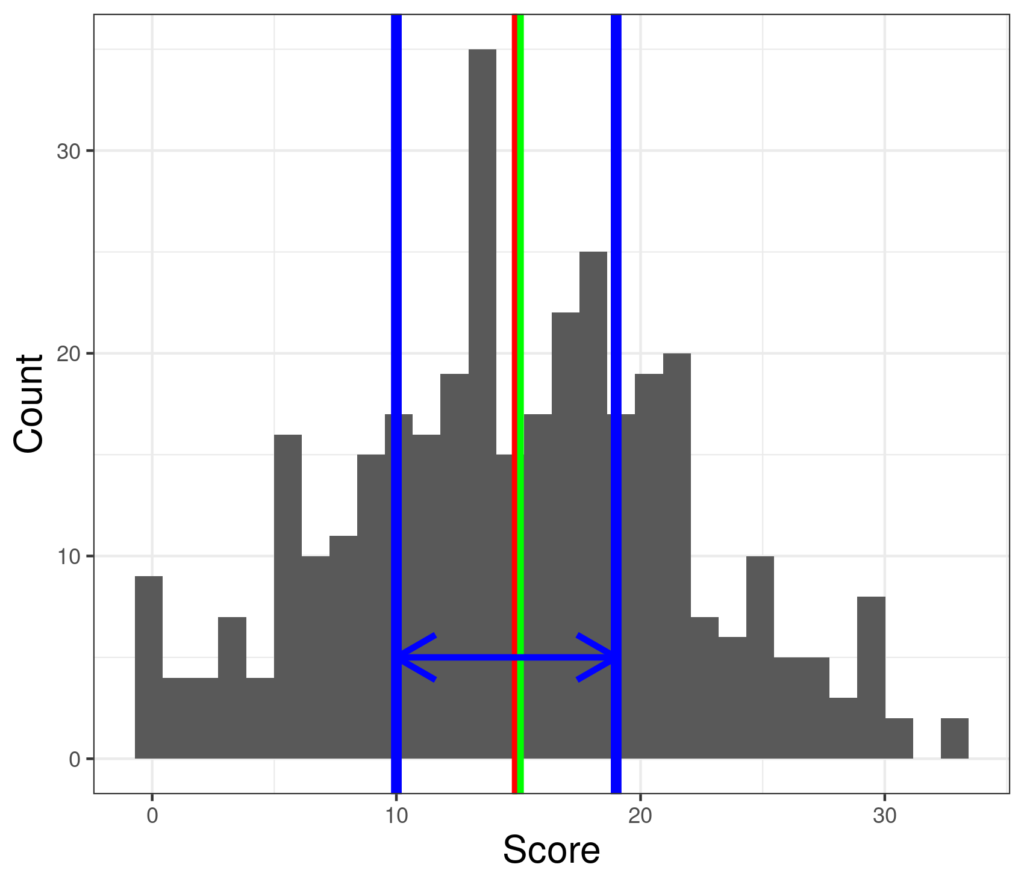
Here is the interquartile range for a fairly symmetrical distribution of scores. The IQR is marked by the blue horizontal arrow between the vertical markers of the quartiles. The mean is marked in red and the median in green.
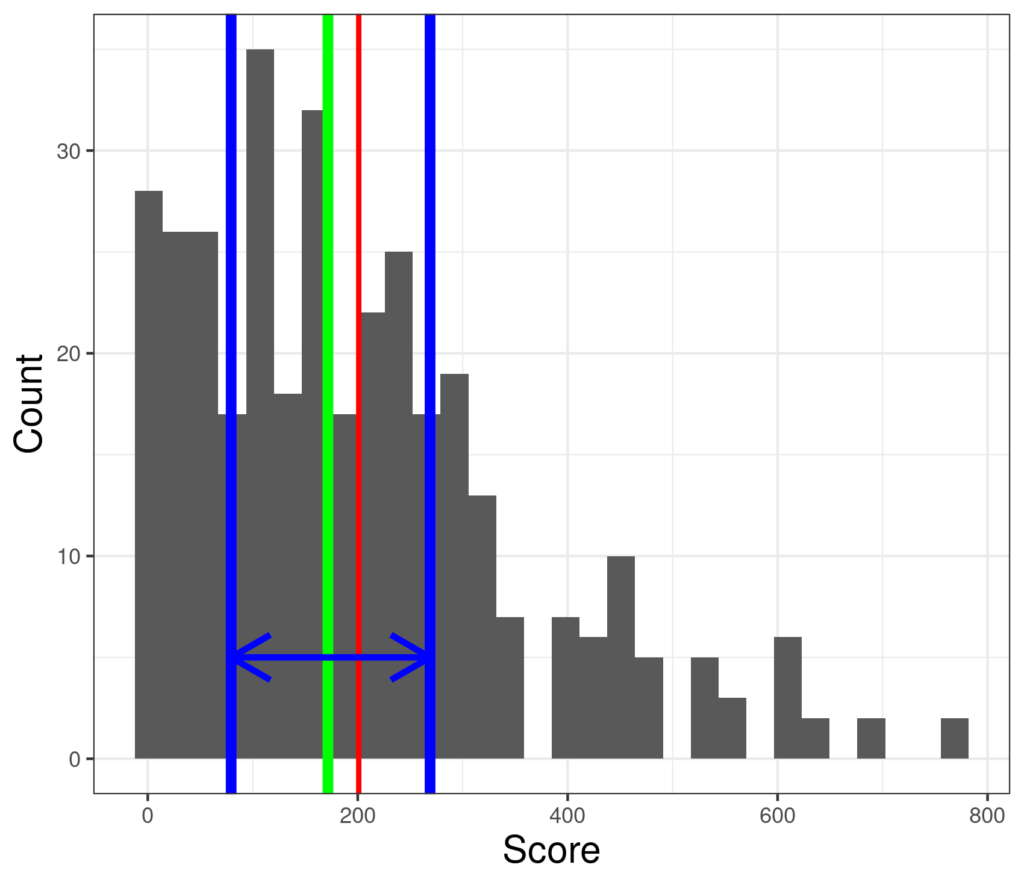
Here, with the same markers is a markedly positively skew set of scores.
Though it’s perhaps useful to know what an IQR is, I can’t say I see them a lot and perhaps as it has become easier to produce plots of distributions, and as online publication removes the reluctance journals used to have about allowing distribution plots (they were costly to print), the IQR as a summary will perhaps become even rarer.
Try also #
Quartiles
Quantiles
Summary statistics
Distribution
Histogram
Chapters #
Chapter 5
Online applications #
In due course there will be a shiny app to compute the IQR and other summary statistics for a set of data.
Dates #
Created 1.xi.21

