What it says! The gradient of a linear regression. See the entry Regression and linear regression for the background but this shows the slope for a simple (perfect) linear regression line.
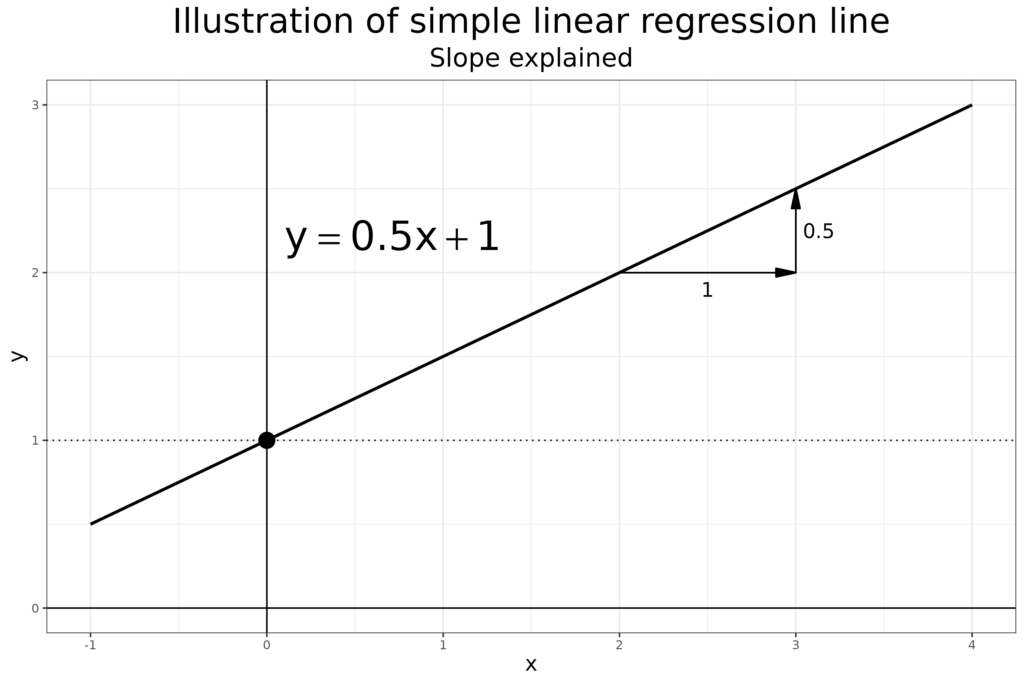
That shows that for any increase of 1.0 on the x axis the y value goes up by .5. This quite often comes up either looking across many clients in terms of a slope for improved well-being against number of sessions attended or, within one client, for the change in their scores session on session. Mathematically, those are exactly the same linear regression equation but statistically they are two radically different things as the observations from many different clients for the first are independent of one another (if we ignore clustering within practitioners or within services). By contrast the serial scores from one client are anything but independent. See Independence of observations for more on this crucial issue which takes regression into Multilevel Models/Modelling (MLM). However, this all starts from linear regression models and their slopes.
Of course, with real data things are never beautiful straight lines like the above. Here I made things a bit more realistical.
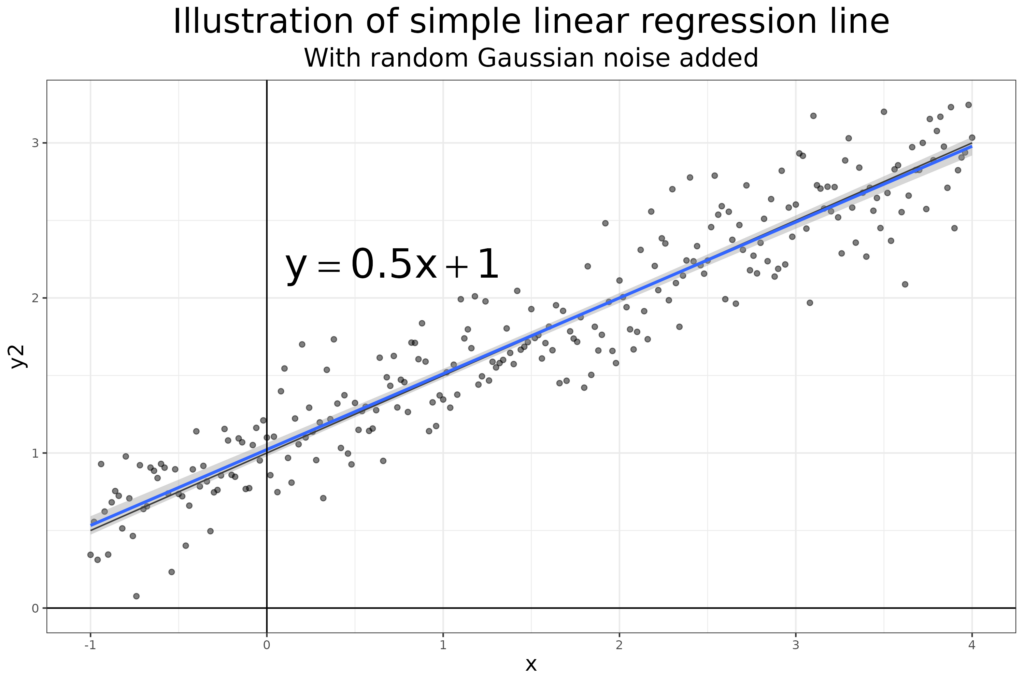
Because the noise is random, the best fitting linear regression to the noisy data (n = 251), shown in blue there with a light blue 95% confidence interval around it, doesn’t have a slope of exactly 0.5, the best fit slope is .489.
Try also #
Independence of observations
Intercept
Multilevel Models/Modelling (MLM)
Regression and linear regression
Chapters #
Used in Chapter 8 and mentioned in Chapter 10.
Online resources #
None yet.
Dates #
First created 15.iv.24, tweaked 16.iv.24.

