Overprinting is the name for a challenge when plotting large datasets in a scatterplot.
Details #
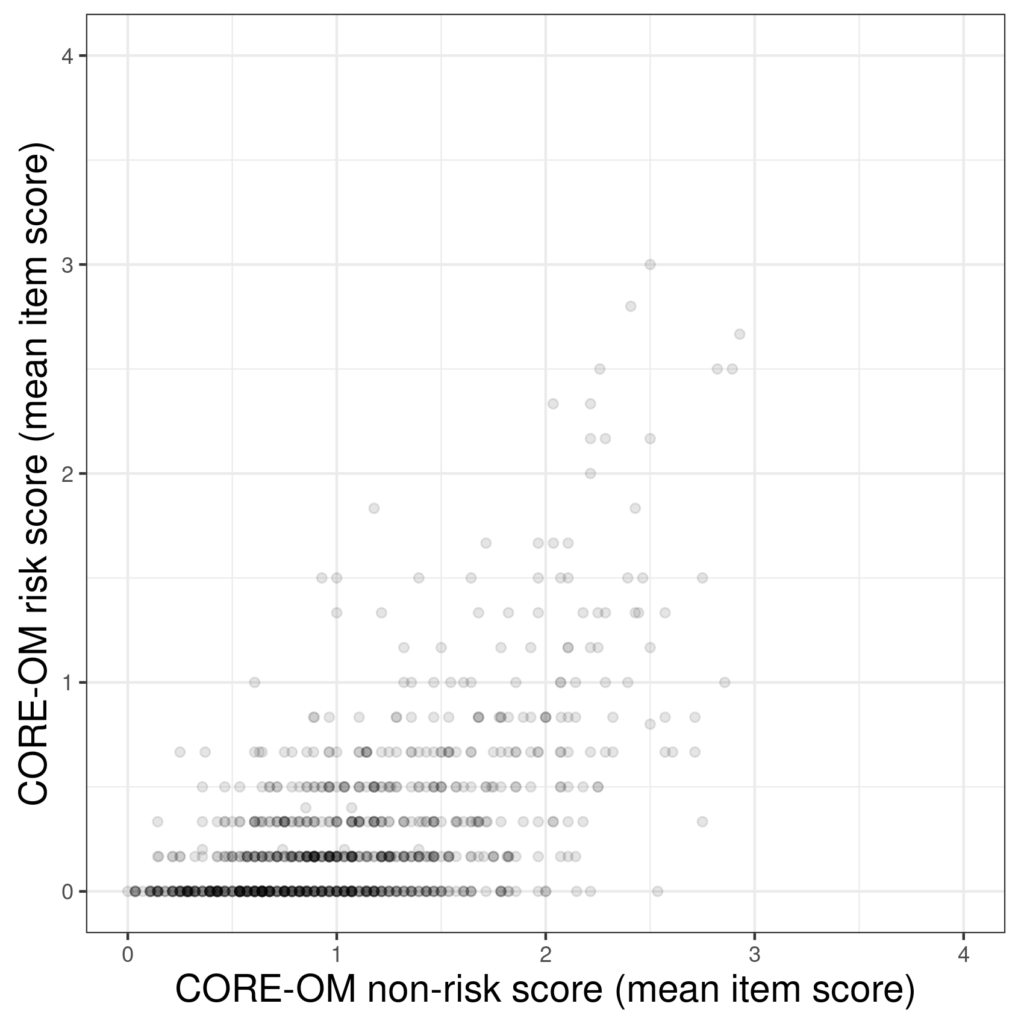
The problem is that when you have a large dataset it becomes likely that two or more people will have the same values for both variables (or values so close that the points can’t be distinguished in the plot). That starts to distort the impression conveyed by the plot as pairs of scores that occurred frequently will have the same visual impact as those pairs that only occurred once. Here’s an example.

That’s a plot of 883 pairs of scores (from a non-help-seeking sample of young adults in Quito, Ecuador). However, were to be able to count the points you see there you would only find 346 as the remaining points pairs happened more than once. In fact one pair of scores (.643 on the non-risk scale and zero on the risk scale) occurred 19 times. This plot is giving a misleading picture.
Here’s an even more extreme example from the same dataset: n = 878 with complete data on two items from the CORE-OM: items 6 and 27.

This shows us that at least one person of the 878 has had 24 of the 25 possible score pairs (0 and 0 through to 6 and 6) with only the pairing of 3 on item 27 and 4 on item 6 missing. Apart from that it tells us nothing!
Solutions for overprinting #
One way around this is transparency: to us a less than opaque fill for the points so that the overprinted points are darker.
Another option is to use the area of the point to show how many times it occurred.
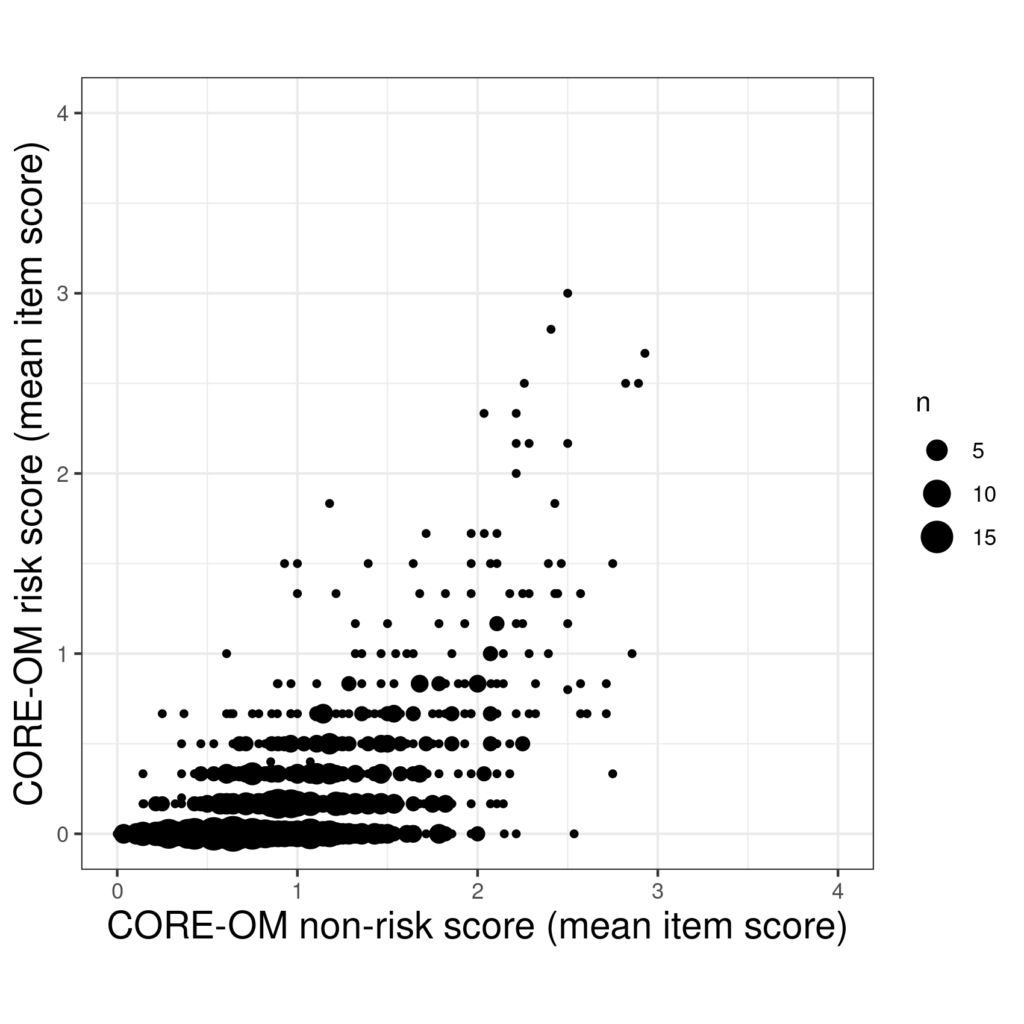
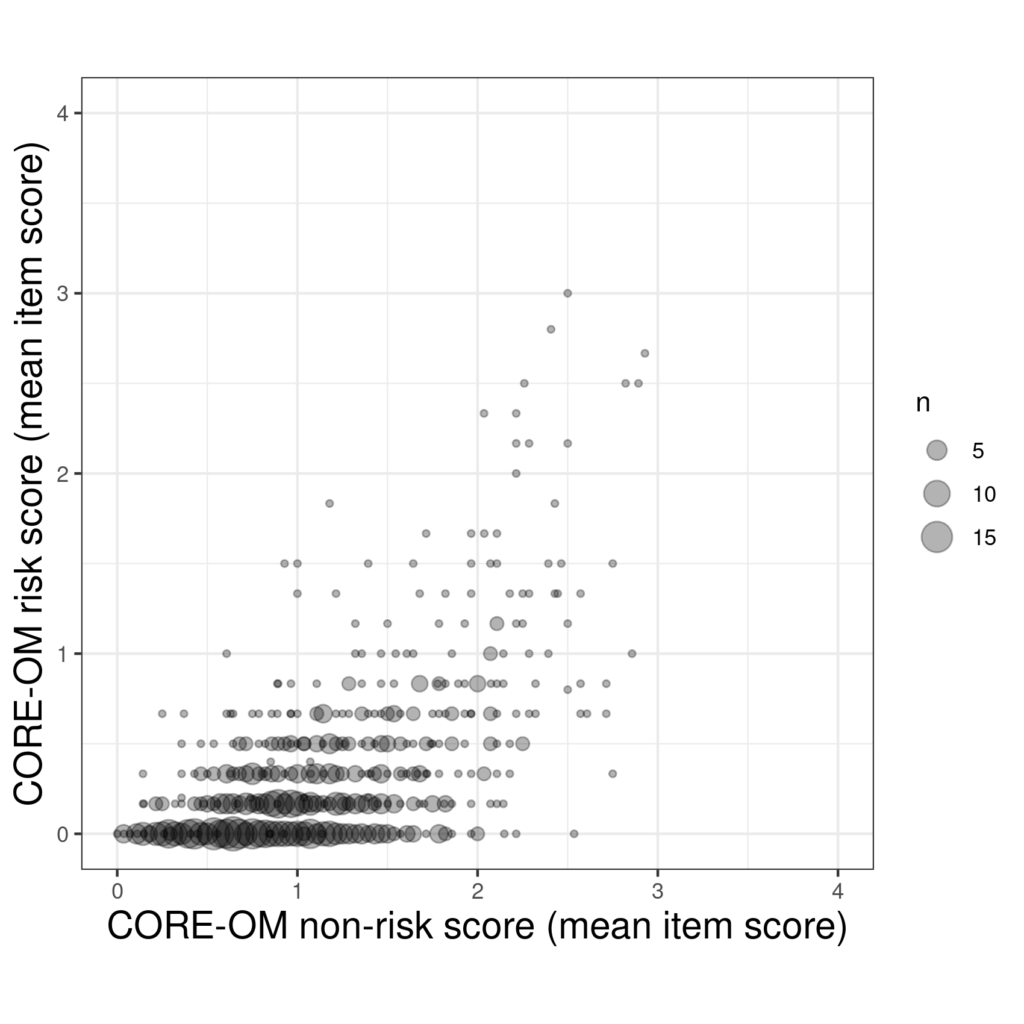
That certainly conveys a sense of the frequency and location of the repeated pairs of scores but there is still an overprinting challenge. Perhaps combinging transparency and point size works.
Another option, the last that I know, is jittering.
Try also #
Jittering
Scatterplots
Regression
Chapters #
Chapter 5.
Local links #
For those using R my “Rblog” entry is probably useful (and if you don’t know R, dipping into it my Rblog might tempt you toward it!)
Dates #
Created 16/11/21.

