This is a distribution where all possible values are equiprobable. Also called the rectangular and sometimes the “flat” distribution from the shape of the histogram.
Details #
The classic example in statistics is tossing dice: each time a die is tossed, if it is a fair die, the probability of it showing 1, 2, 3, 4, 5 or 6 is the same: 1 in 6. Here are four samples each of six dice being thrown (or one die being thrown six times!)

We can see that the observed scores aren’t “flat” or uniform, the first sample has 3, 4, 5 and 6 each coming up once but 2 comes up twice and 1 didn’t come up at all. Here are some bigger samples.
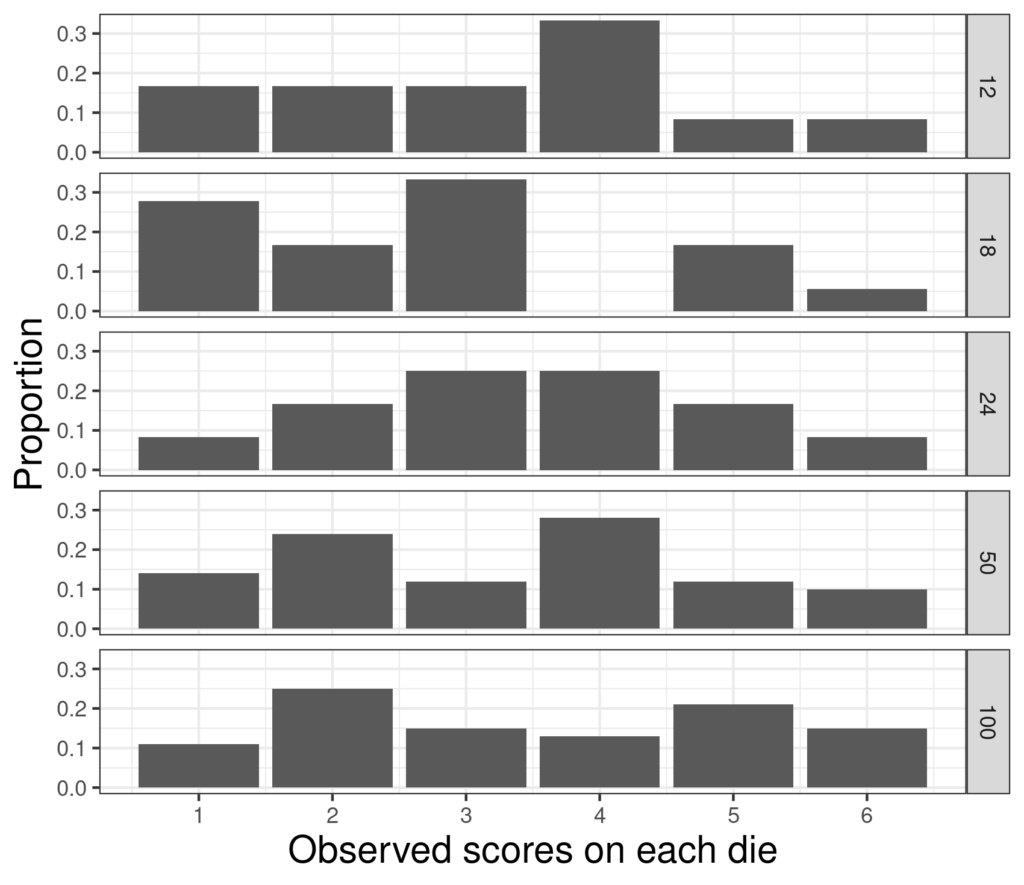
The sample sizes are on the right and now instead of plotting counts I have plotted proportions. It can be seen that as the sample sizes increase to 100 the lumpiness decreases and the observed distributions do look flatter though still hardly “flat”. What about bigger samples still?
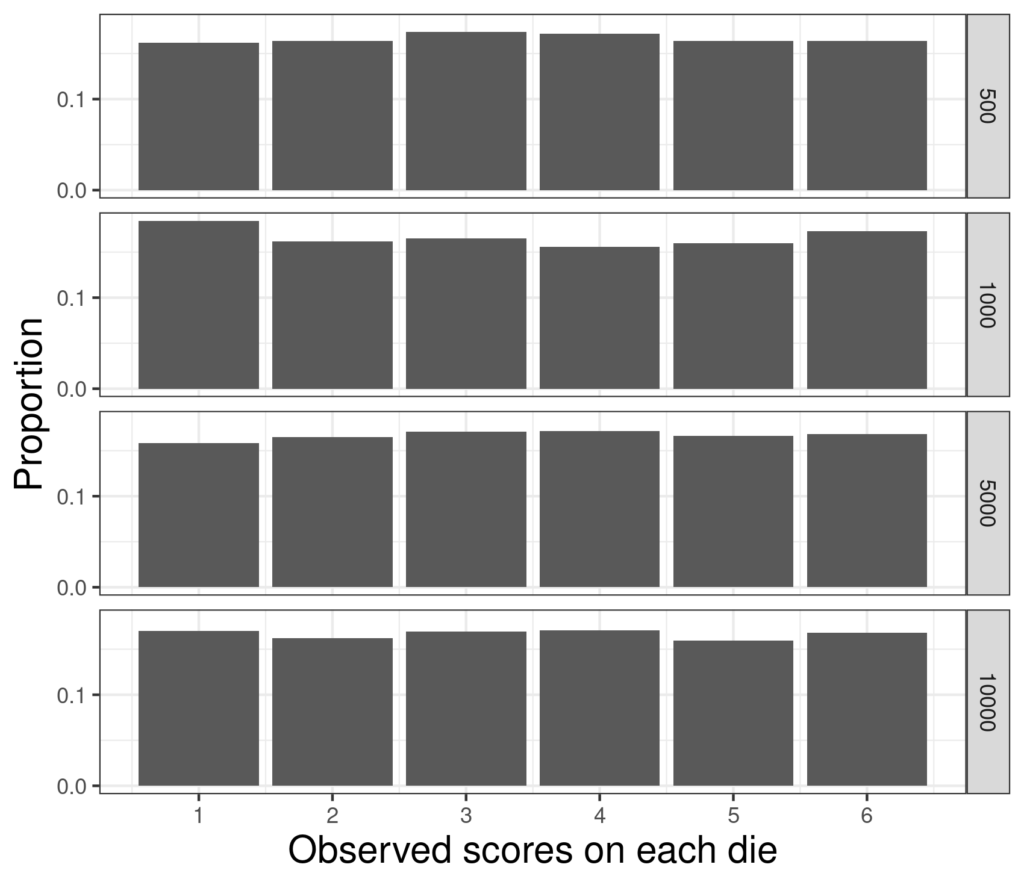
It’s pretty rare that therapy sample sizes reach 10,000 but we can see that even there the distributions aren’t perfectly flat, however, they are clearly flattening out toward the uniform probability of 1/6 for each score.
The idea of equiprobable independent events is at the heart of many statistical methods: a fairly general “null model”, particularly for the chi squared test and its many relatives.
Try also #
Distribution
Gaussian (“Normal”) distribution
Probability
Histogram
Sample size
Null hypothesis/model
Inferential statistics
P values
Chi squared test
Online resources #
* You can generate samples from distributions using my shiny app: https://shiny.psyctc.org/apps/Create_univariate_data/. At the moment it only creates Gaussian and uniform distributions but more distributions may follow. You can download the data or copy and paste it to other apps.
* You could then paste the data into another app: https://shiny.psyctc.org/apps/ECDFplot/ to get a sense of how your samples change was you change the size or the population parameters (mean and SD for the Gaussian; minimum and maximum for the uniform distribution).
Chapters #
The issue of distributions and of how sample size impacts on what we can infer sensibly from data is central to chapters 5, 6, 7 and 8 and really it pervades all thinking about change data.
Dates #
Created 2.xi.21, updated links 14.viii.24.

