The fundamental issue in empirical research and data: how much scores on variables differ. It goes back to the fundamental idea that we can only name something if we also know in principle what “not that something” is: we understand by differences as much as by similarities and equalities and we can’t have any classifications without differences: variance.
Details #
Although variance applies to counts and so to nominal/categorical variables as much as to ordered/numbered variables it’s easiest to think about variance for ordered variables, for numbers where it is a measure of the scatter of the data around the mean.
Let’s take some real data from a non-help-seeking sample of 883 completing the CORE-OM (and some other measures, the data led to (Evans et al., 2021; Paz, Evans, et al., 2020; and Paz, Mascialino, et al., 2020, see references). The sample was large enough that there was at least one person scoring zero on every item and at least one scoring 4: the entire range of possible items was used on all items. However, the distributions of items scores differed markedly across items. Here are the distributions for six of the items.
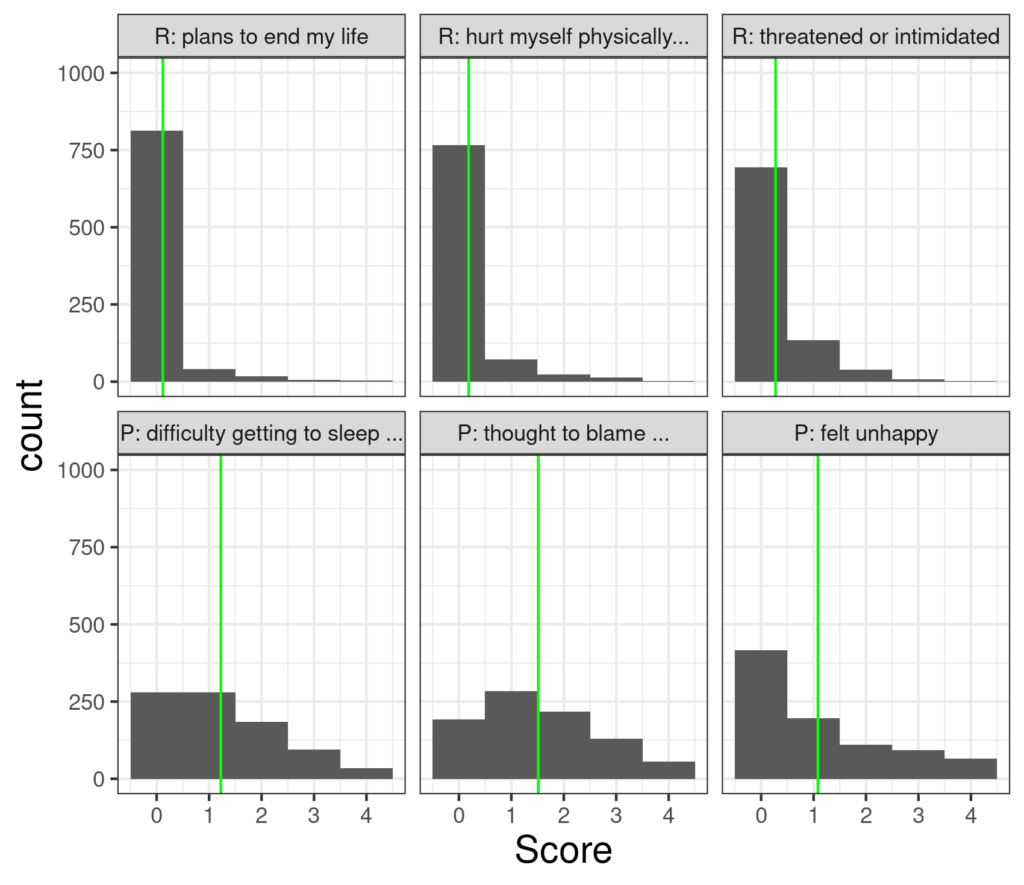
The three items on the top row of that composite plot are the three items with the least variance and the three on the bottom row are the three with the most variance. (The plot is a facetted histogram: the facets are the six separate plots). As you would hope the overwhelming majority of those who answered item 16 “Over the last week … I made plans to end my life” answered “Not at all” and that was similar for the next two risk items (items 34 and 22). By contrast there is much more spread across the response levels (“Not at all” to “Most or all the time”) on the three items from the problem domain of the measure.
Technically variance is mean squared difference between each observation in the data and the mean of those observations. To give a very simple xample, if the observations were 1, 2 and 3 then their mean is 2 and the variance is 2/3 as the differences from the mean are -1, 0 and 1 respectively and the squares of those are 1, 0 and 1 so total 2 and mean 2/3. If the observations were 1, 2, 3, 4 and 5 then the mean is 3 and the deviations from the mean are -2, -1, 0, 1 and 2 and their squares are 4, 1, 0, 1 and 4, sum 10 and mean of that, i.e. the variance, is 10/5, 2.
It’s probably a bit more common to see the “standard deviation” (SD) quoted than the variance, the SD is just the positive square root of the variance so for the little dataset of 1, 2 and 3, the variance is 2/3 and the SD is .82, i.e the number which when squared, multiplied by itself, comes to 2/3 (OK .82*.82 is .6724, not strictly 2/3, if we want to be more precise go to 0.8164966 as 0.8164966 squared is 0.6666667). Here is the same CORE-OM item data elaborated to show the means, variances and SDs for each item and with the span of one SD either side of the mean shown in blue.

It can be seen that the scatter is much greater for the bottom row of items than for the upper row. Welcome to variance!
(Why) Does it matter? #
There are a number of reasons that variance/SD matter. Firstly it’s clearly a useful way to know that some samples have more scatter than others. Different services may have similar mean therapy starting score means but, largely depending on referral processes and pre-therapy selection, they may have very different scatter around that mean, very different score variances,and this will have implications when comparing the services.
Secondly, if distributions are Gaussian (see that entry) then knowing the mean and variance (or SD) means that the entire distribution of scores is known from just those two numbers. (But this is a bit of an abstraction.)
Finally, following from that specific if rather theoretical fact, a huge realm of statistics works essentially entirely through “analysis of variance” and one particular subset of such statistics is simply called “ANOVA” from ANalysis Of VAriance.
Try also #
Distribution
Gaussian distribution
Statistical tests
Null hypothesis
Inter-quartile range/interval (IQR/IQI)
Parametric statistics
Bootstrapping
Confidence intervals
Chapters #
Mainly chapter 5.
References #
Evans, C., Paz, C., & Mascialino, G. (2021). “Infeliz” or “Triste”: A Paradigm for Mixed Methods Exploration of Outcome Measures Adaptation Across Language Variants. Frontiers in Psychology, 12, 695893. https://doi.org/10.3389/fpsyg.2021.695893
Paz, C., Evans, C., Valdiviezo-Oña, J., & Osejo-Taco, G. (2020). Acceptability and Psychometric Properties of the Spanish Translation of the Schwartz Outcome Scale-10 (SOS-10-E) Outside the United States: A Replication and Extension in a Latin American Context. Journal of Personality Assessment, 1–10. https://doi.org/10.1080/00223891.2020.1825963
Paz, C., Mascialino, G., & Evans, C. (2020). Exploration of the psychometric properties of the Clinical Outcomes in Routine Evaluation-Outcome Measure in Ecuador. BMC Psychology, 8(1), 94–105. https://doi.org/10.1186/s40359-020-00443-z

