This is a bit of small print but it’s such a lovely word … and such a useful tool to achieve an accurate visual representation of your data in a scatterplot if you are faced with overprinting.
Details #
Here’s the example from the entry on overprinting.

That’s plotting 883 observations but only 346 points as there were many participants with the same two scores. Jittering involves adding a little random shift to observed scores so they don’t overprint (or at least, overlap rather than superimposing). You can jitter vertically, horizontally or both. Here the scores on the x axis, the non-risk scores, are tightly packed at least for the participants scoring zero on the y axis, the risk scale so horizontal jittering isn’t going to help but what about vertical jittering?
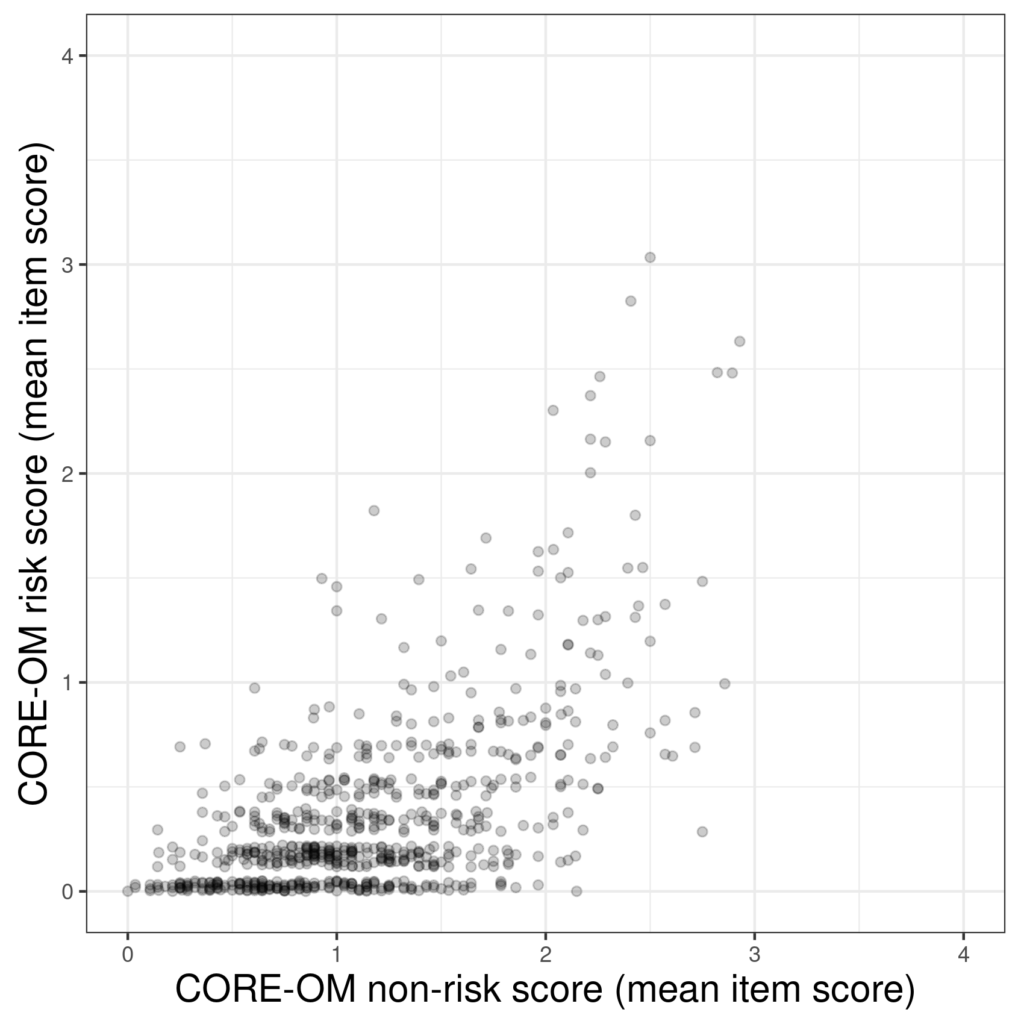
That used both jittering and transparency to handle the overprinting. It’s worth a bit of experimenting to get the vertical spread of “jitter” sufficient to spread the points but not so much as to obscure any discreteness of scores (we can see the discreteness of the risk scores in the first plot above). Here jittering alone wasn’t enough and combination with transparency has probably got a good visual representation of the actual data.
Here’s a different example (again continuing from the overprinting entry here). It’s from the same dataset: n = 878 with complete data on CORE-OM items 6 and 27.

This a much easier candidate for jittering.
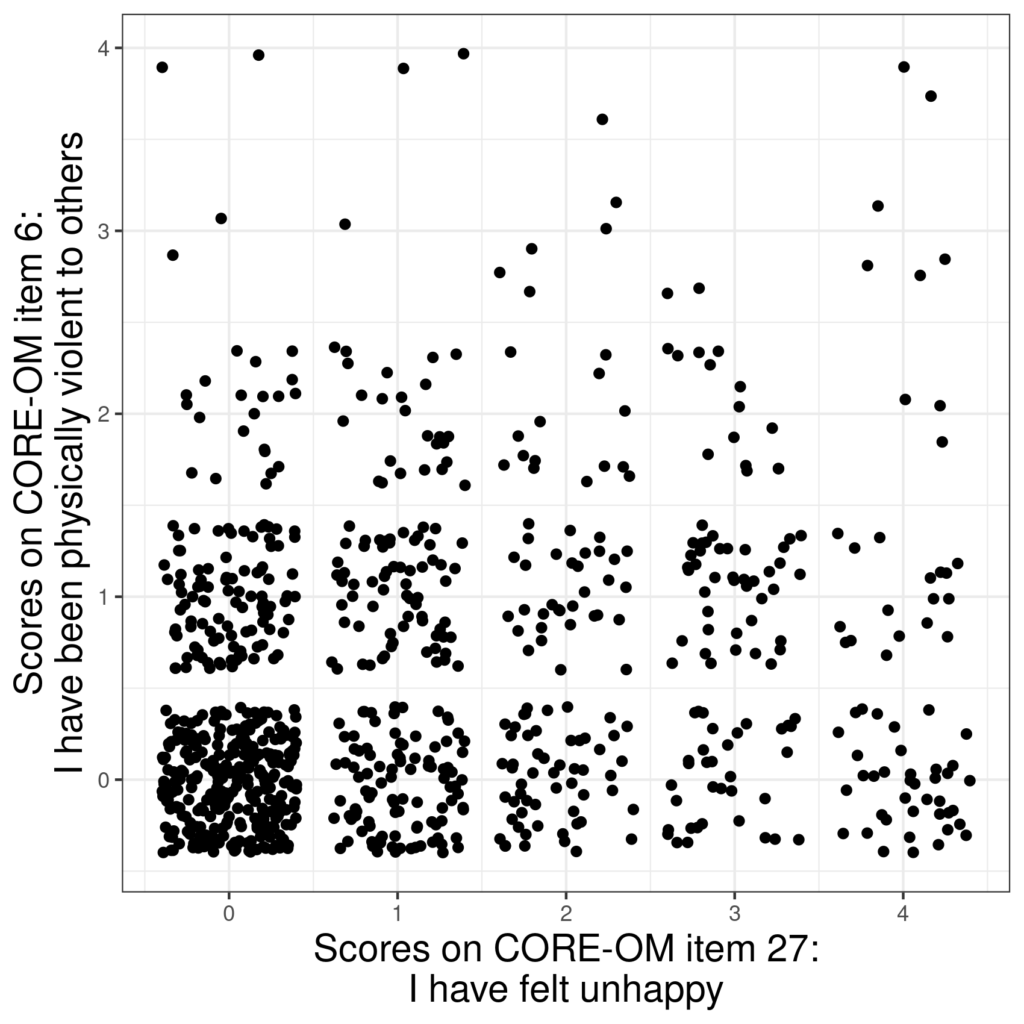
Here the challenge was to choose the extent of the jittering to use as much of the space for the 0,0 pair of scores while preserving a gap between the scores to show that they were discrete. One obvious choice was to use the same amount of jittering on both the x and y axes, reflecting that these are equispaced possible scores. Here is the same with transparency as well as jittering.
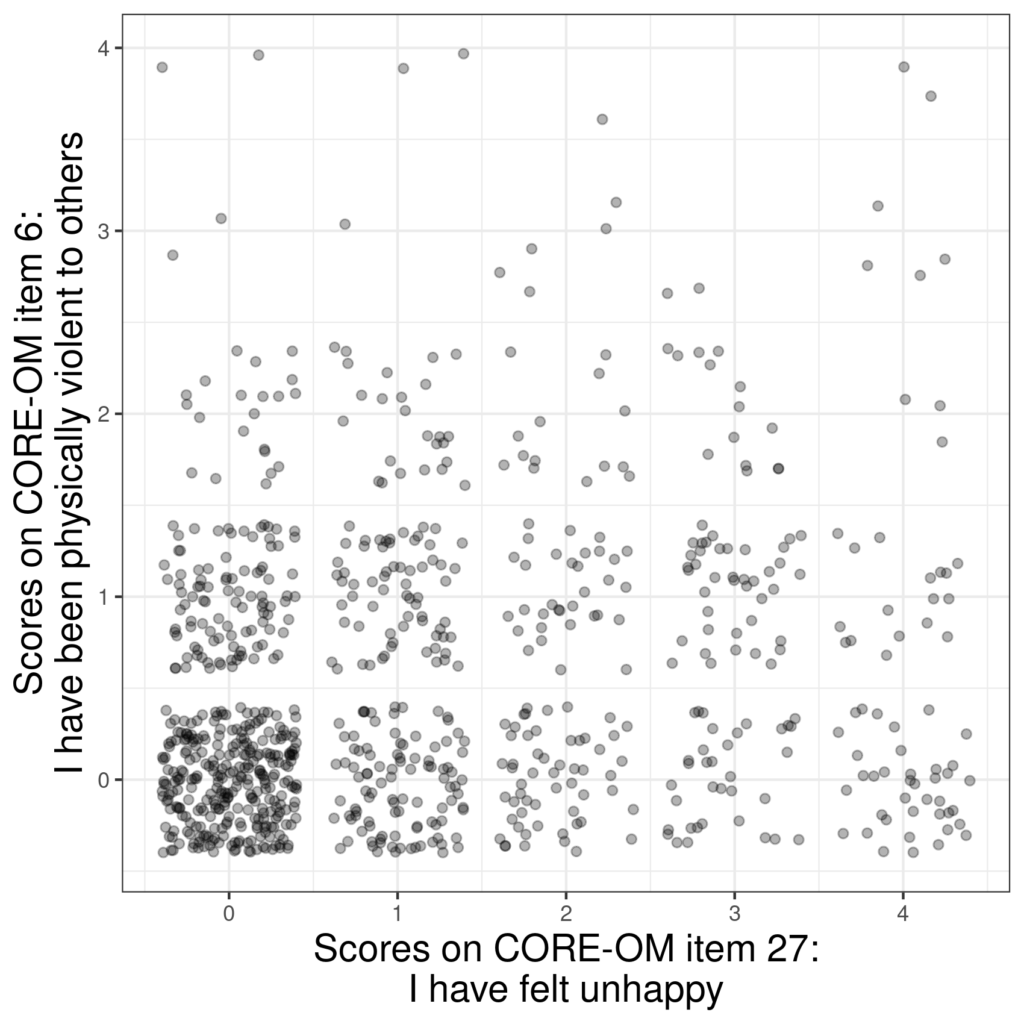
Such is the density in the 0, 0 pair of scores that with this screen area that’s probably as good a visual representation as one can get of these data.
Try also #
Overprinting
Scatterplots
Regression
Chapters #
Chapter 5.
Local links #
For those using R my “Rblog” entry is probably useful (and if you don’t know R, dipping into it my Rblog might tempt you toward it!)
Handling overprinting
and perhaps the related issue: Nudging groupings on plot axes
Dates #
Created 16/11/21.

