A qq plot from my Rblog post Explore distributions with plots
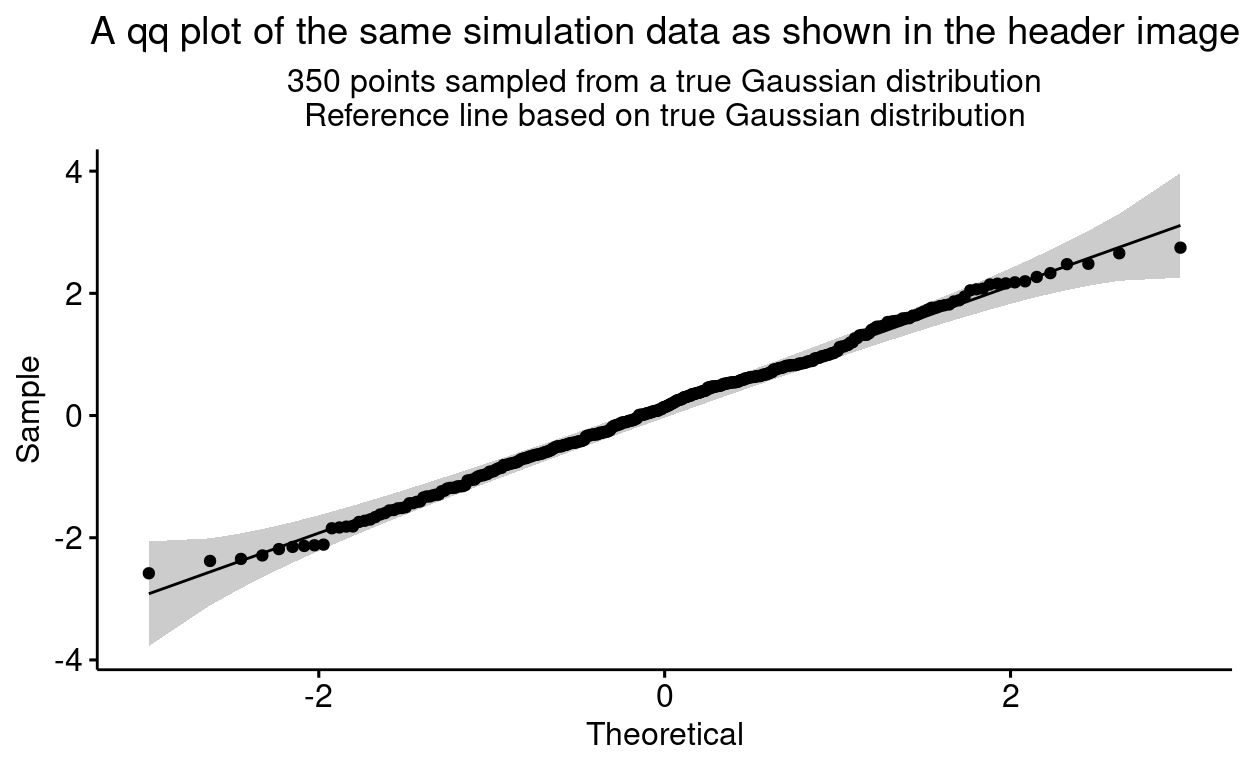
These are diagnostic plots used to explore similarities between the distribution of values/scores in a sample against a theoretical distribution, typically the Gaussian distribution, or to compare distributions of two distributions.
Details #
Go to Rblog post Explore distributions with plots for the explanation.
Try also #
Gaussian (“Normal”) distribution
Kolmogorov-Smirnov test
Anderson-Darling test
Cramer von Mises test
Shapiro-Wilk test
Shapiro-Francia test
Null hypothesis testing
Distribution shape
Null hypothesis significance testing (NHST) paradigm
Sampling and sample frame
Population
Chapters #
Not in the book
Online resources #
My Rblog post:
* Explore distributions with plots
My shiny apps:
* App creating samples from Gaussian distribution showing histogram, ecdf and qqplot
Dates #
First created 19.xi.23

