It’s pretty much what it says: putting the data you have in order so that the counts mount up to the total number of observations you have. It’s a fairly familiar way of tabulating things but a less familiar way of plotting them but it can be a very helpful way to plot as well as to tabulate and it underpins a lot of the ways that statisticians think about and model distributions.
Details #
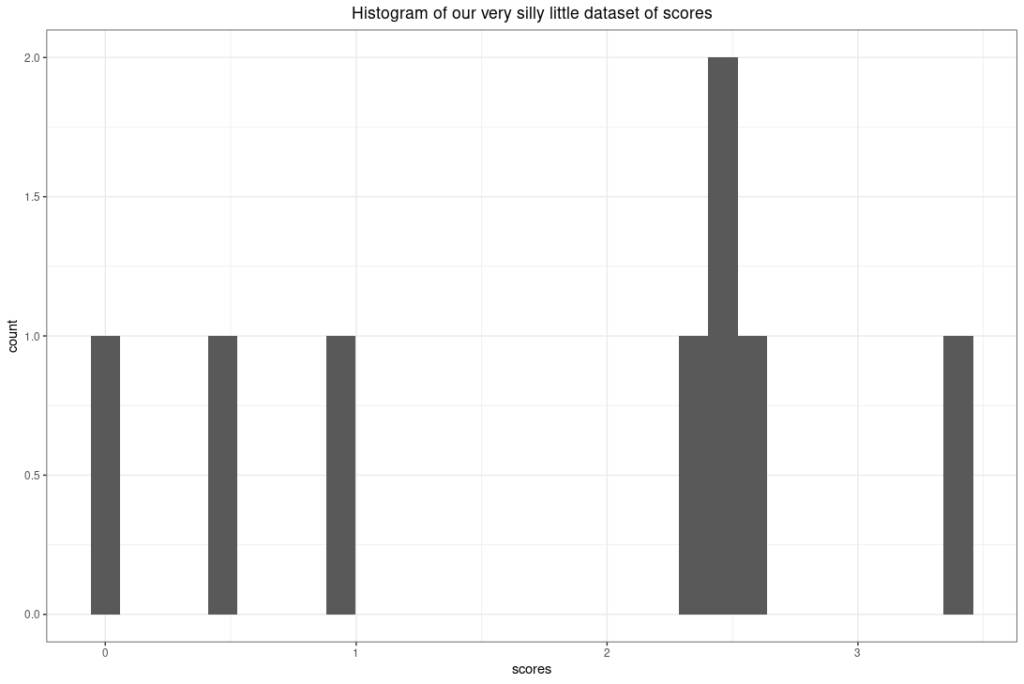
Suppose you have some data like this.
| scores |
|---|
| 0.50 |
| 2.50 |
| 2.40 |
| 2.50 |
| 3.40 |
| 2.60 |
| 0.00 |
| 0.90 |
Here’s a histogram of that dataset!
Now here’s a very common way to tabulate that dataset: sorted, with percentages and cumulative percentages.
| scores | n | percent | cumPerc |
|---|---|---|---|
| 0.00 | 1 | 12.5% | 12.5% |
| 0.50 | 1 | 12.5% | 25.0% |
| 0.90 | 1 | 12.5% | 37.5% |
| 2.40 | 1 | 12.5% | 50.0% |
| 2.50 | 2 | 25.0% | 75.0% |
| 2.60 | 1 | 12.5% | 87.5% |
| 3.40 | 1 | 12.5% | 100.0% |
That last column is a cumulative distribution. Here it is mapping scores to their cumulative distribution as a cumulative percentage between zero and 100%, you may also see it between zero and 1 (cumulative proportion) and you might also see it terms of cumulative n which here would between zero and eight. This distribution give us the cumulative distribution plot.
That’s pretty uninteresting with a tiny dataset and only one variable but cumulative distributions come into their own with larger datasets and a second variable. For example exploring the relationship between gender and CORE-OM scores.
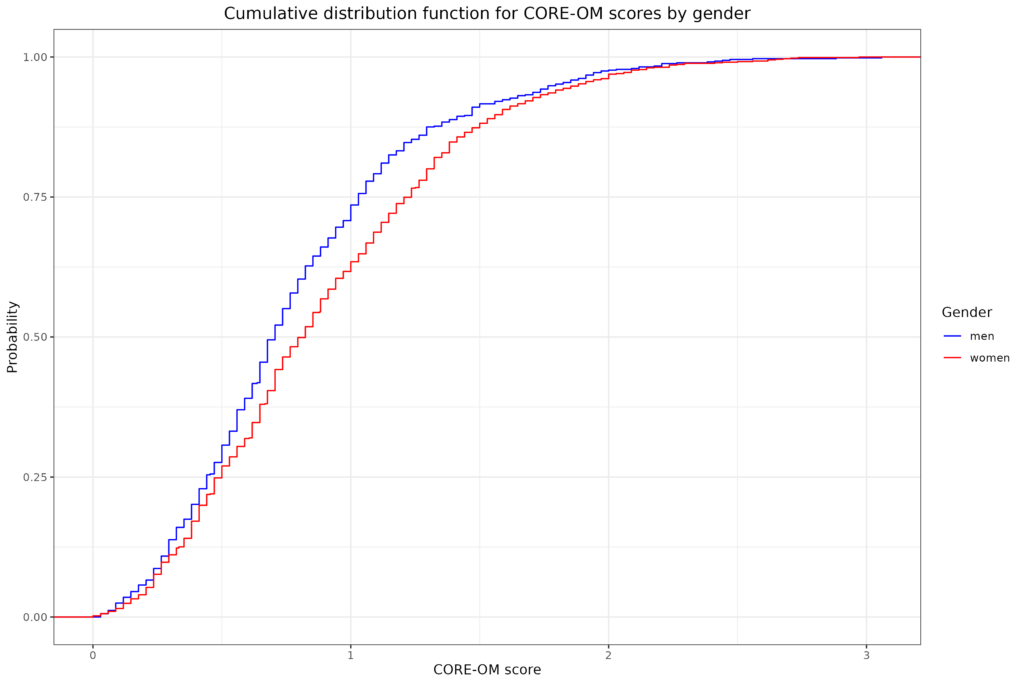
I always have to remind myself that the fact that ECDF line for the women is under that for the men is because the women are tending to score higher generally than the men so the quantiles for the women tend to be higher (to the right of) those for the men. A non-parametric test with the glorious name of the Kolmogorov-Smirnov test is a formal test of whether the largest absolute vertical distance between the lines is larger than you would expect to have happened had Gender had no relationship with score in the population and this just a chance sampling vagary.
Try also #
Distribution
Empirical Cumulative Distribution Function (ECDF)
Histograms and boxplots
Kolmogorov-Smirnov test
Violin plots
Chapters #
Not in the book.
Online resources #
Rblog posts:
* What is an empirical cumulative distribution function?
* Confidence intervals for quantiles
* Mapping individual scores to referential data using quantiles
My interactive shiny apps:
* Plot ECDF with CIs for arbitrary quantiles
* App creating samples from Gaussian distribution showing histogram, ecdf and qqplot
* App that takes data, pasted in or uploaded in various formats, and plots the ecdf with confidence intervals for quantiles of your choosing!
Dates #
First created 8.xii.23, tweaked links 6.v.24.

